Chart Art: Is Bitcoin (BTC/USD) Getting Ready For Another Leg Higher?
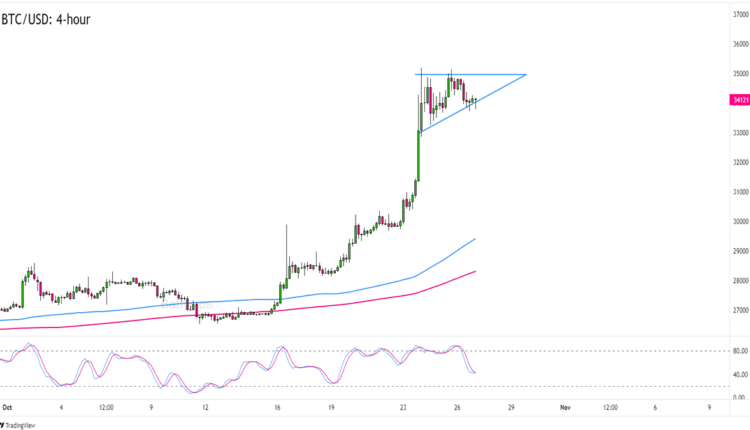
Bitcoin (BTC/USD) is consolidating in a chart pattern after mooning in the last few days!
Does this mean that the king of crypto is ready for a reversal? Or are BTC bull just getting a breather?
We’re taking a closer look at the 4-hour chart for clues:

BTC/USD 4-Hour Forex Chart by TradingView
If you’re wondering why the crypto bros that you’re following are suddenly posting again, it’s likely because bitcoin (BTC/USD) popped up from its sub-27,000 levels all the way to the 34,000 area in only a few days.
Are you feeling FOMO over BTC/USD’s sharp upswing? We may see some more in the next trading sessions.
But that’s only if BTC/USD busts above its ascending triangle/bullish pennant pattern in the 4-hour time frame! Remember that consolidations can break in either direction and that a downside breakout is still likely.
BTC/USD’s current levels near its trend line support may attract buying pressure especially if the trend line holds and the pair sees bullish candlesticks.
A clear break above the 35,000 psychological handle may lead to retests of previous areas of interest such as 38,000 or 40,000.
But if BTC/USD makes new daily lows, or if the pair consistently trades below the 33,000 mark, then we can consider a possible dip back down to the big 30,000 previous inflection point.
What do you think? Which way will BTC/USD go?


Comments are closed.