Australian Dollar Jumps After China GDP Beat; What’s Next for AUD/USD?
Australian Dollar, US Dollar, AUD, US, China Data – Talking Points:
- The Chinese economy more than forecast in the third quarter.
- Industrial output, retail sales grew more than expected last month.
- What does this mean for AUD/USD?
Looking for actionable trading ideas? Download our top trading opportunities guide packed with insightful tips for the fourth quarter!
Recommended by Manish Jaradi
Get Your Free Top Trading Opportunities Forecast
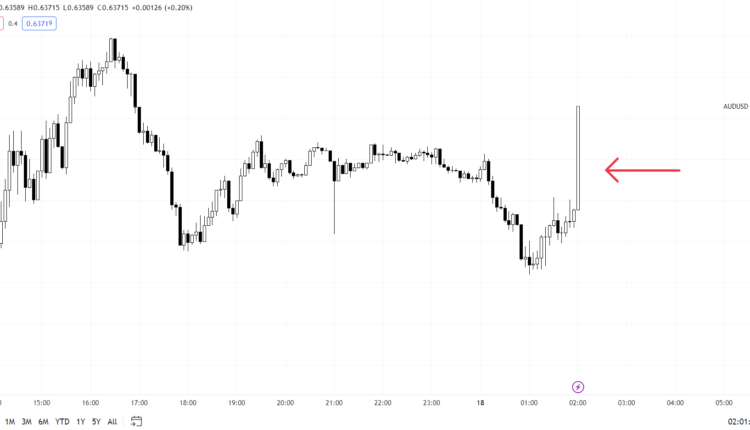
The Australian dollar jumped against the US dollar after the Chinese economy grew more than expected in the July-September quarter.
The Chinese economy grew 4.9% on-year in the July-September quarter, Vs 4.4% expected and 6.3% in the previous quarter. Industrial production grew 4.5% on-year in September, Vs 4.3% expected and 4.5% in August. Retail sales grew 5.5% on-year, Vs 4.9% expected and 4.6% in August. Fixed asset investment grew 3.1% on-year in the January-September period Vs 3.2% expected.
The better-than-expected China data is likely to provide some comfort to investors after inflation data released last week showed domestic demand remains under pressure, suggesting that the economic turnaround could be longer than initially expected. Improving macro data since last month has raised hopes that growth in the second-largest economy could be bottoming, thanks to a series of support/stimulus measures announced by China in recent months.
AUD/USD 5-minute Chart
Chart Created by Manish Jaradi Using TradingView
Meanwhile, minutes of the RBA’s October 3 meeting published on Tuesday showed the Board was concerned that inflation wasn’t cooling as hoped, and reiterated that some further tightening may be required. They stressed that they have a very low tolerance for slower return of inflation back to target.
RBA Governor Michele Bullock reiterated the hawkish bias early Wednesday, saying authorities will respond with policy if inflation stays higher than expected. The key focus is now on Australian jobs data is due on Thursday and will likely provide cues heading into the RBA policy meeting next month.
AUD/USD Daily Chart

Chart Created by Manish Jaradi Using TradingView
On technical charts, AUD/USD has been holding above support on the lower edge of a declining channel since August, around minor support at the early-October low of 0.6285. While the pair may have stabilized in recent weeks, the short-term downside risks won’t be eliminated unless AUD/USD breaks above resistance at the end-August high of 0.6525.
Given concerns that the Middle East conflict could widen, the bar appears to be rather high for the pair to witness a sustained rebound. The 14-day Relative Strength Index has been capped at 50-55 suggesting the broader trend remains down. Subsequent barrier is on the upper edge of the Ichimoku cloud on the daily charts.
Curious to learn how market positioning can affect asset prices? Our sentiment guide holds the insights—download it now!
Recommended by Manish Jaradi
Improve your trading with IG Client Sentiment Data
— Written by Manish Jaradi, Strategist for DailyFX.com
— Contact and follow Jaradi on Twitter: @JaradiManish


Comments are closed.