GBP/USD, EUR/GBP Show that Sterling Remains Pressured
British Pound, GBP/USD, GBP/JPY – Technical Update:
Recommended by Daniel Dubrovsky
How to Trade GBP/USD
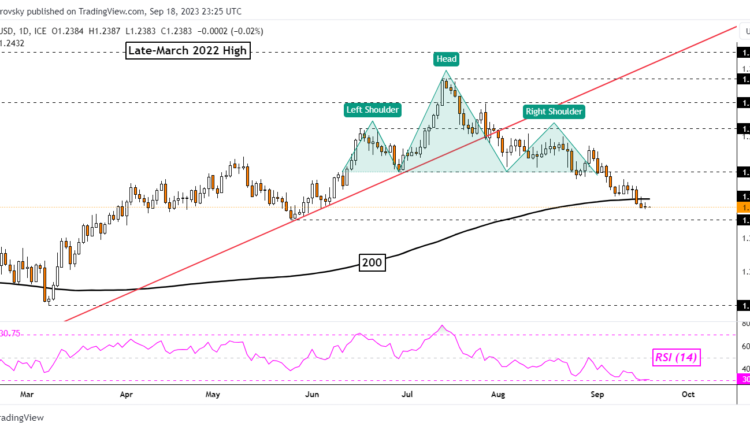
The British Pound may be readying to extend its losing streak against the US Dollar. For context, GBP/USD has been aiming lower since breaking under a bearish Head & Shoulders chart formation, opening the door to an increasingly downward technical bias. Now, prices have confirmed a breakout under the 200-day Moving Average.
That is further underscoring the bearish GBP/USD view, placing the focus on immediate support which is now the May low of 1.2308. This will likely be the next key test. Pushing lower underscores, the near-term bearish bias. Otherwise, a turn higher places the focus back on the neckline of the Head & Shoulders, which is around 1.2592.
| Change in | Longs | Shorts | OI |
| Daily | 4% | 12% | 6% |
| Weekly | 16% | -13% | 5% |
Chart Created in TradingView
Meanwhile, the British Pound is also losing ground to the Euro. On the daily chart below, EUR/GBP is attempting to confirm a breakout above the 0.861 inflection point and the 100-day Moving Average. While this could open the door to a stronger bullish technical bias for the exchange rate, the broader horizon remains neutral.
EUR/GBP remains in a consolidative setting between resistance (0.8658 – 0.8701) and support (0.8493 – 0.8519). Recent progress does open the door to revisiting the former, as well as the broader falling trendline from February. These could hold as resistance. As such, there is more work for EUR/GBP to do before shifting to a stronger bullish technical bias.
Recommended by Daniel Dubrovsky
The Fundamentals of Breakout Trading

Chart Created in TradingView
— Written by Daniel Dubrovsky, Senior Strategist for DailyFX.com


Comments are closed.