
- Dow Jones flat on Wednesday as S&P 500, NASDAQ Composite sink.
- DJIA looks to be rotating lower on the daily chart with 34,257 a possible target for support.
- Disney will report FQ3 earnings after the close on Wednesday.
- Inflation data from CPI, PPI arrive on Thursday and Friday.
The Dow Jones Industrial Average (DJIA) opened flat on Wednesday, performing much better than both the S&P 500 and the NASDAQ Composite. That latter two both traded lower at the open, especially the growth-heavy NASDAQ. The DJIA index reversed course on Tuesday (-0.45%) following Monday’s 1.16% gain.
The broad equity market in the US is stutter-stepping ahead of significant inflation data that appears later in the week. On Thursday morning, the US Consumer Price Index (CPI) for July arrives, and on its heels the Producer Price Index (PPI) gets released Friday morning. The results of both will help to determine the outlook for interest rate policy at the Federal Reserve’s (Fed) September policy meeting.
Dow Jones Industrial Average News: Market will turn on inflation data
The US Bureau of Labor Statistics is set to release July’s Consumer Price Index data an hour before the market opens on Thursday. Wall Street consensus is projecting core inflation to arrive at 4.7% YoY, a slight improvement from June’s reading of 4.8%. Expectations for July’s monthly core CPI is right in line with June’s rate at 0.2%.
Headline CPI that includes the more volatile food and energy prices is forecast to rise due to elevated Oil prices. The economic indicator is expected to advance from June’s 3% reading to 3.3% on an annual basis in July. West Texas Intermediate (WTI) has climbed from the low $70s to the low $80s over the past month as Saudi Arabia and Russia have extended their production cuts.
Then on Friday the Producer Price Index (PPI) data for July is expected to rise 2.3% YoY, down from 2.4% in June. If either of these inflation readings come in above consensus, it will give the Dow Jones index an excuse to sell off. The market is worried that stubbornly high inflation could force the Federal Reserve’s hand in raising interest rates at its September meeting. At the moment, the odds are better than 80% that the Fed will pause rates in September, per the CME Group’s FedWatch Tool.
Disney to report FQ3 results after Wednesday close
The Walt Disney Company (DIS) has been part of the Dow Jones since 1991 and accounts for a little under 2% of the overall index. The entertainment powerhouse ran into some difficulties during the pandemic, cutting its dividend in the process, and the market has pretty much ignored it for the past year.
Disney – back in the hands of long-time CEO Bob Iger – is expected to report adjusted EPS of $0.99 and GAAP EPS of just $0.05. Revenue is expected to arrive at $22.53 billion.
Iger returned to Disney last November, but in an interview in July he admitted to CNBC that his two-year turnaround plan for the conglomerate was looking more like a four-year phase. The company’s Disney+ and Hulu streaming segments have been popular with consumers but require heavy investment.
“The challenges are greater than I anticipated,” Iger told CNBC.
In remarks he made at the Sun Valley Conference in mid-July after laying off more than 7,000 employees, Iger hinted that Disney’s television assets like ABC, The Disney Channel, FX and National Geographic may be on the chopping block.
Expect executives on the earnings call to address any possible sale of assets. Disney stock has dropped by more than half since its pandemic peak and is down 19% over the past year.
Dow Jones FAQs
The Dow Jones Industrial Average, one of the oldest stock market indices in the world, is compiled of the 30 most traded stocks in the US. The index is price-weighted rather than weighted by capitalization. It is calculated by summing the prices of the constituent stocks and dividing them by a factor, currently 0.152. The index was founded by Charles Dow, who also founded the Wall Street Journal. In later years it has been criticized for not being broadly representative enough because it only tracks 30 conglomerates, unlike broader indices such as the S&P 500.
Many different factors drive the Dow Jones Industrial Average (DJIA). The aggregate performance of the component companies revealed in quarterly company earnings reports is the main one. US and global macroeconomic data also contributes as it impacts on investor sentiment. The level of interest rates, set by the Federal Reserve (Fed), also influences the DJIA as it affects the cost of credit, on which many corporations are heavily reliant. Therefore, inflation can be a major driver as well as other metrics which impact the Fed decisions.
Dow Theory is a method for identifying the primary trend of the stock market developed by Charles Dow. A key step is to compare the direction of the Dow Jones Industrial Average (DJIA) and the Dow Jones Transportation Average (DJTA) and only follow trends where both are moving in the same direction. Volume is a confirmatory criteria. The theory uses elements of peak and trough analysis. Dow’s theory posits three trend phases: accumulation, when smart money starts buying or selling; public participation, when the wider public joins in; and distribution, when the smart money exits.
There are a number of ways to trade the DJIA. One is to use ETFs which allow investors to trade the DJIA as a single security, rather than having to buy shares in all 30 constituent companies. A leading example is the SPDR Dow Jones Industrial Average ETF (DIA). DJIA futures contracts enable traders to speculate on the future value of the index and Options provide the right, but not the obligation, to buy or sell the index at a predetermined price in the future. Mutual funds enable investors to buy a share of a diversified portfolio of DJIA stocks thus providing exposure to the overall index.
What they said about the economy – New York Fed
The Federal Reserve Bank of New York released its Quarterly Report on Household Debt & Credit that looked at American consumers’ use of credit card debt during the second quarter. The number of total credit card accounts rose to 578.4 million in the quarter, and for the first time ever, consumers carried a balance of more than $1 trillion.
“Despite the many headwinds American consumers have faced over the last year – higher interest rates, post-pandemic inflationary pressures, and the recent banking failures – there is little evidence of widespread financial distress for consumers.”
Dow Jones chart forecast
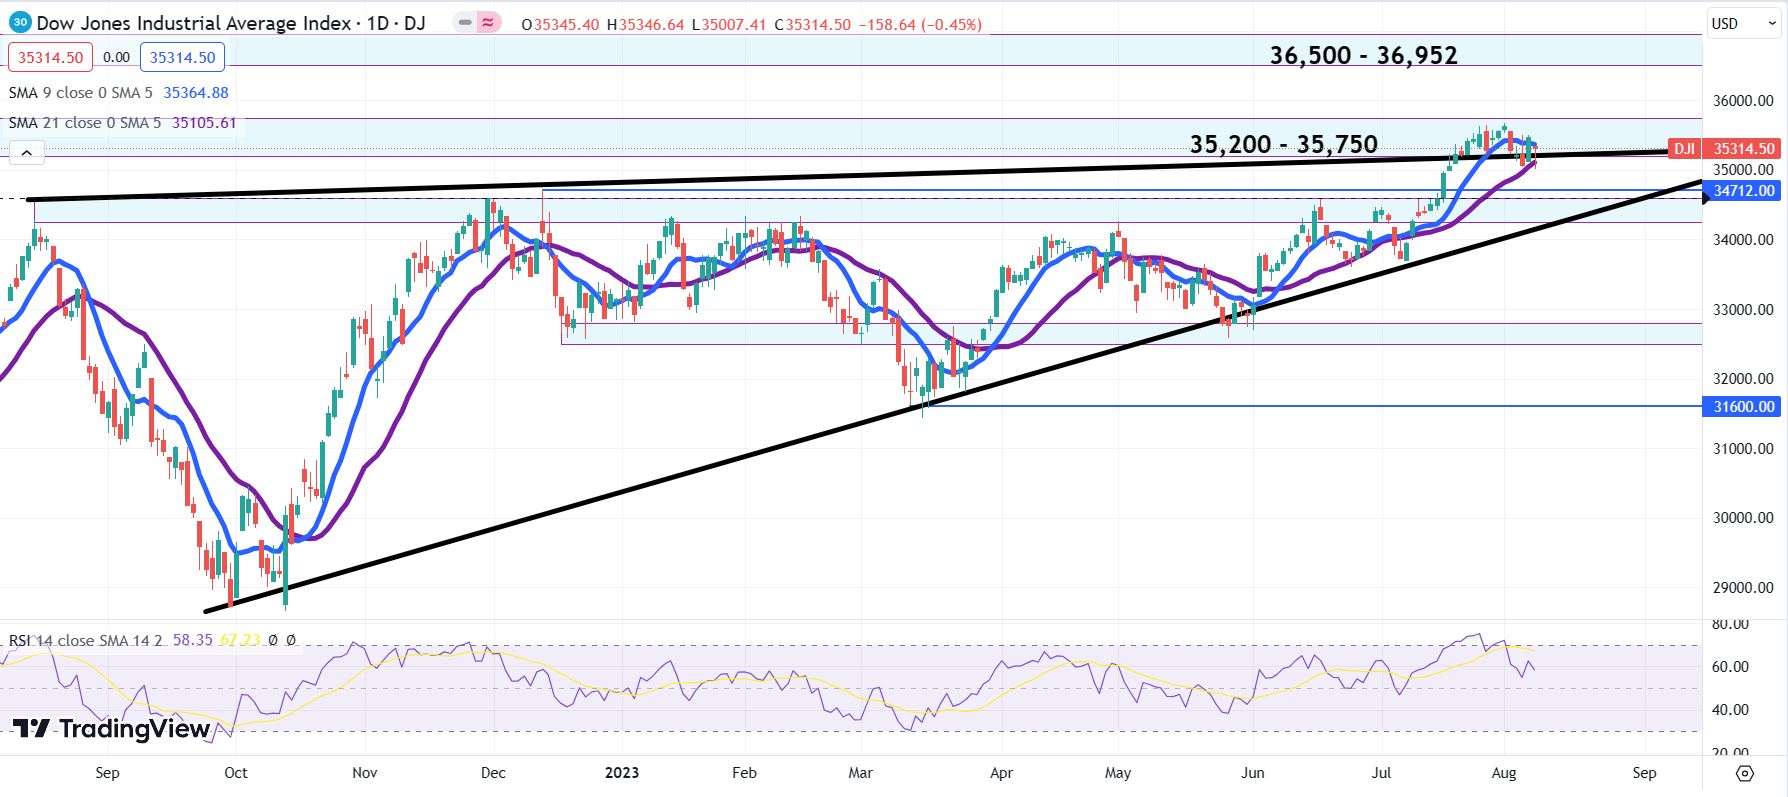
The Dow Jones index briefly dropped below the 21-day moving average on Tuesday but quickly righted the ship. The index has been flirting with a rotation back below the top trendline of the wedge formation it just escaped in previous weeks. The 35,200 to 35,750 resistance zone has appeared to temper the market’s animal spirits, and the DJIA seems poised to consolidate back toward support.
That support could arrive near 34,257 – which is both the lower end of a prior resistance zone and the lower trendline of the aforementioned wedge formation. Based on the Relative Strength Index (RSI), buyers will likely emerge once the indicator shares a reading below 50. The DJIA index has been trending higher since last October, and bulls need a better entry point at present.

Dow Jones Industrial Average daily chart
Comments are closed.