
AUD/USD is starting to trend lower ahead of Australia’s quarterly CPI report and the FOMC decision.
Can these resistance levels hold?
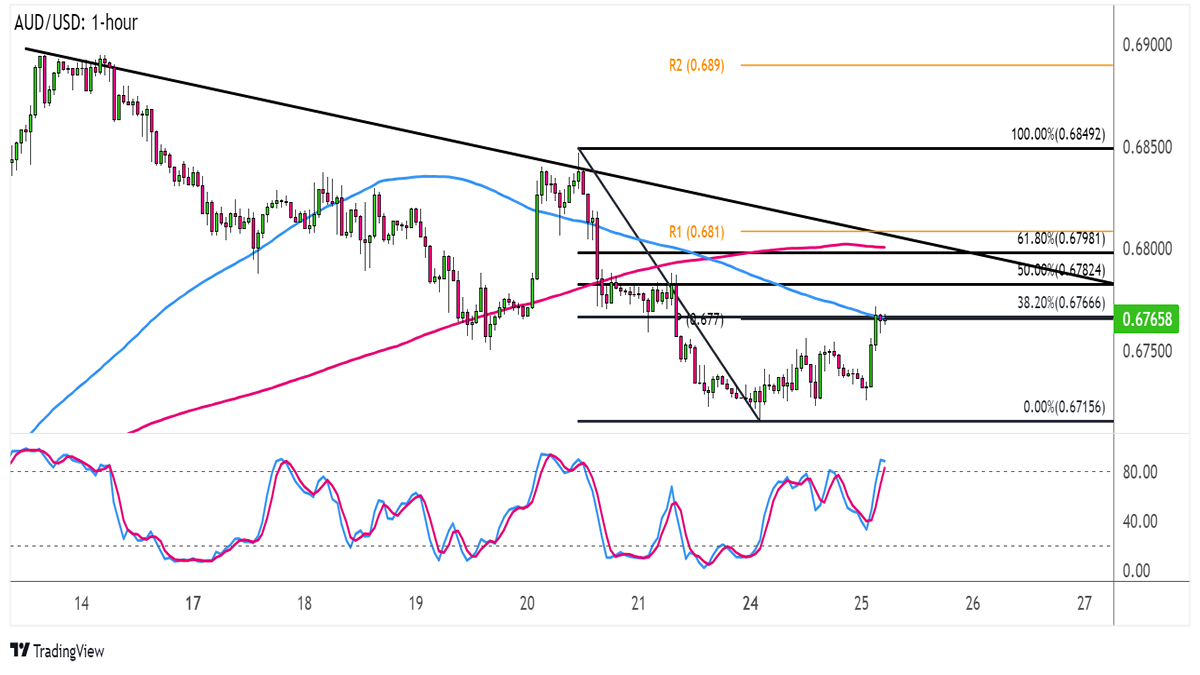
On the hourly time frame, I can see a fresh downtrend forming, as the pair made lower highs connected by a descending trend line.

AUD/USD 1-hour Forex Chart by TV
This pair is already testing the 38.2% Fibonacci retracement on its latest swing high and low, but it might still be in for a larger pullback ahead of the CPI release.
If so, AUD/USD could test the 50% Fib or the 61.8% level closer to the falling trend line resistance and .6800 major psychological mark.
This is also near R1 (.6810) which might be the line in the sand for a short-term bearish pullback. A break above this area could signal that a reversal is in the works.
If resistance zones hold, on the other hand, AUD/USD could resume the slide to the swing low at .6715 or until S1 (.6680). After all, technical indicators are hinting at a continuation of the selloff.
The 100 SMA is below the 200 SMA to suggest that the path of least resistance is to the downside while Stochastic is approaching the overbought zone to reflect exhaustion among buyers.
Number crunchers are projecting weaker inflationary pressures in Australia for Q2, as the quarterly reading is slated to dip from 1.4% to 1.0% while the year-over-year figure could dip from 5.6% to 5.5%.
Weaker than expected results could spell more downside for the Aussie, as this might dash hopes for another RBA hike. Meanwhile, the dollar could stay supported leading up to the FOMC decision this week since traders are still expecting another 0.25% hike.
This content is strictly for informational purposes only and does not constitute as investment advice. Trading any financial market involves risk. Please read our Risk Disclosure to make sure you understand the risks involved.
Comments are closed.