Falling wedge lures Mexican Peso bears, focus on 16.80
- USD/MXN portrays falling wedge bullish chart formation at the lowest levels since December 2015.
- Gradually firmer RSI (14) favors gradual recovery of the Mexican Peso pair.
- Convergence of 100-SMA, weekly resistance line appears a tough nut to crack for bulls.
- Sellers could aim for late 2015 lows on breaking 16.67 support.
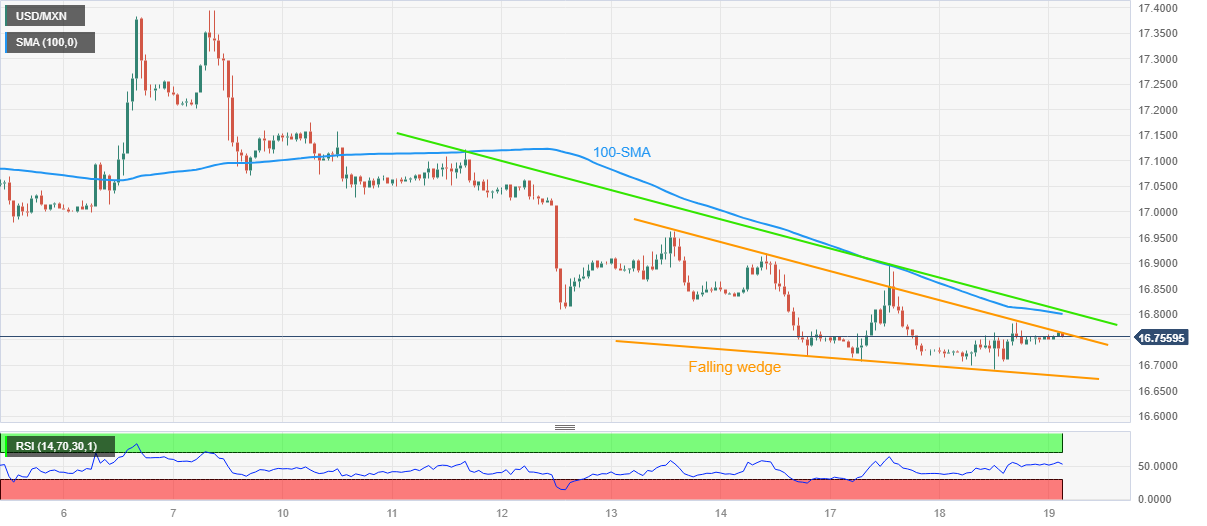
USD/MXN grind near intraday high as it prods the key upside hurdle within a bullish chart pattern during early Wednesday, close to 16.75 by the press time.
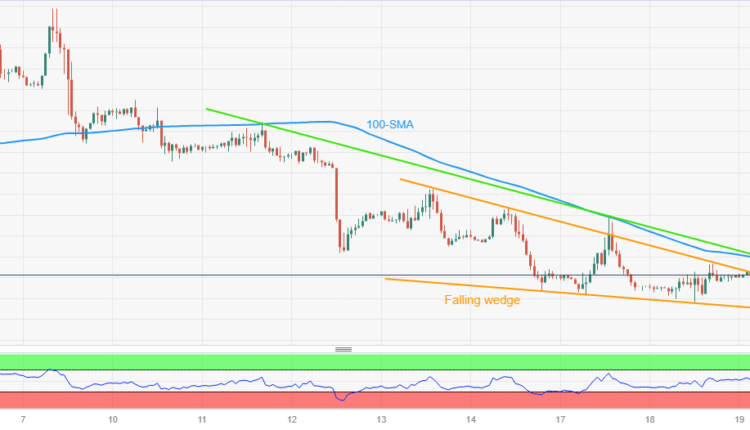
In doing so, the Mexican Peso (MXN) pair jostles with an upper line of a one-week-old falling wedge bullish formation.
Adding credence to the recovery hopes is the RSI (14) line that portrays higher lows, as well as mark the divergence with the price even when the USD/MXN dropped to a fresh low since December 2015.
With this, the USD/MXN pair is likely to confirm the falling wedge chart pattern by crossing the 16.76 hurdle, which in turn suggests a theoretical target of 17.03.
However, a convergence of the 100-SMA and a descending trend line from July 11, around 16.80 at the latest, appears a tough nut to crack for the pair buyers.
On the contrary, the latest multi-month low marked on Tuesday, around 16.69, precedes the stated wedge’s bottom line of near 16.67 to restrict the short-term downside of the USD/MXN pair.
Following that, the lows marked in December and November of 2015, respectively around 1647 and 16.35, will gain the Mexican Peso pair seller’s attention.
USD/MXN: Hourly chart
Trend: Limited recovery expected


Comments are closed.