

Article by IG Chief Market Analyst Chris Beauchamp
Dow Jones, Nasdaq 100, Nikkei 225 Analysis and Charts
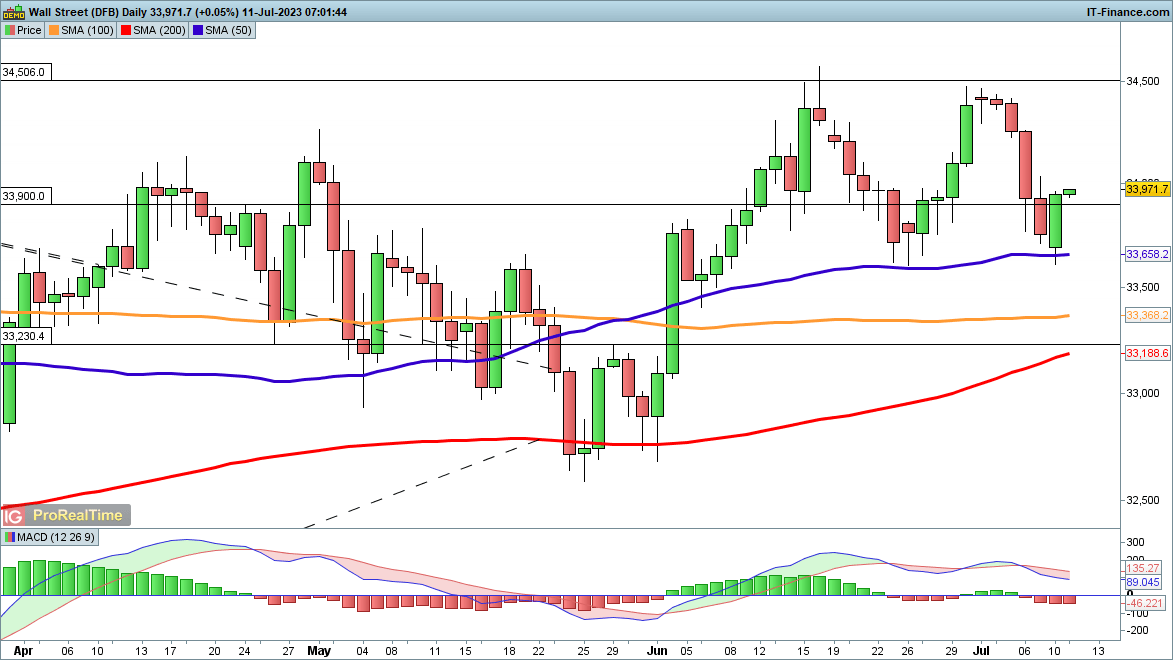
Dow Jones stuck below 34,000.
The index rallied off the 50-day SMA on Monday, repeating a bounce from late June from around the 33,650 area. This has helped to stem the bearish case for now, and now the bulls will want to see additional gains above 34,000 that might put the index on course for a fresh attempt to clear the 34,500 area that blocked upside progress over the last month.
Sellers will need a reversal back below 33,600 to indicate that a new push towards the 200-day SMA is in the offing.
Dow Jones Daily Price Chart
Recommended by IG
Traits of Successful Traders
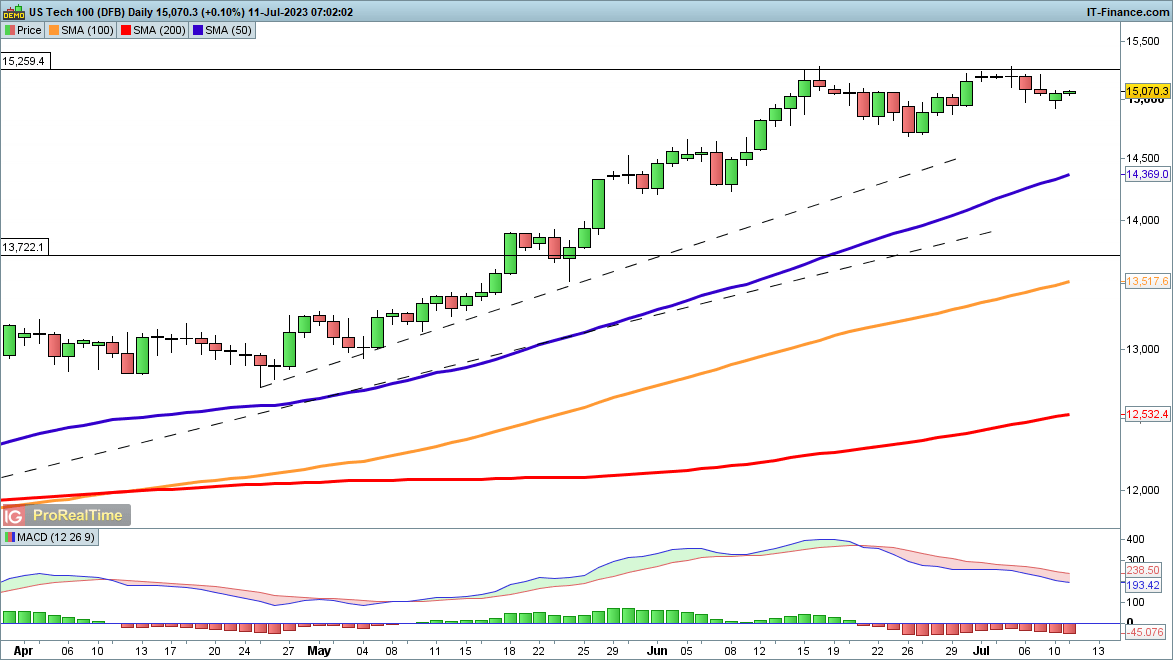
Nasdaq 100 is back above 15,000.
Buyers appeared on Monday to stem the declines and push the index back above 15,000.In recent months the index has avoided any significant pullback, and a fresh pushback above 15,260 might open the way to new one-year highs.
Sellers will want a move back below 15,000 to suggest that a deeper pullback might yet develop, a view that is supported by an ongoing decline in the daily MACD indicator.
Nasdaq 100 Daily Price Chart
Trade Smarter – Sign up for the DailyFX Newsletter
Receive timely and compelling market commentary from the DailyFX team
Subscribe to Newsletter
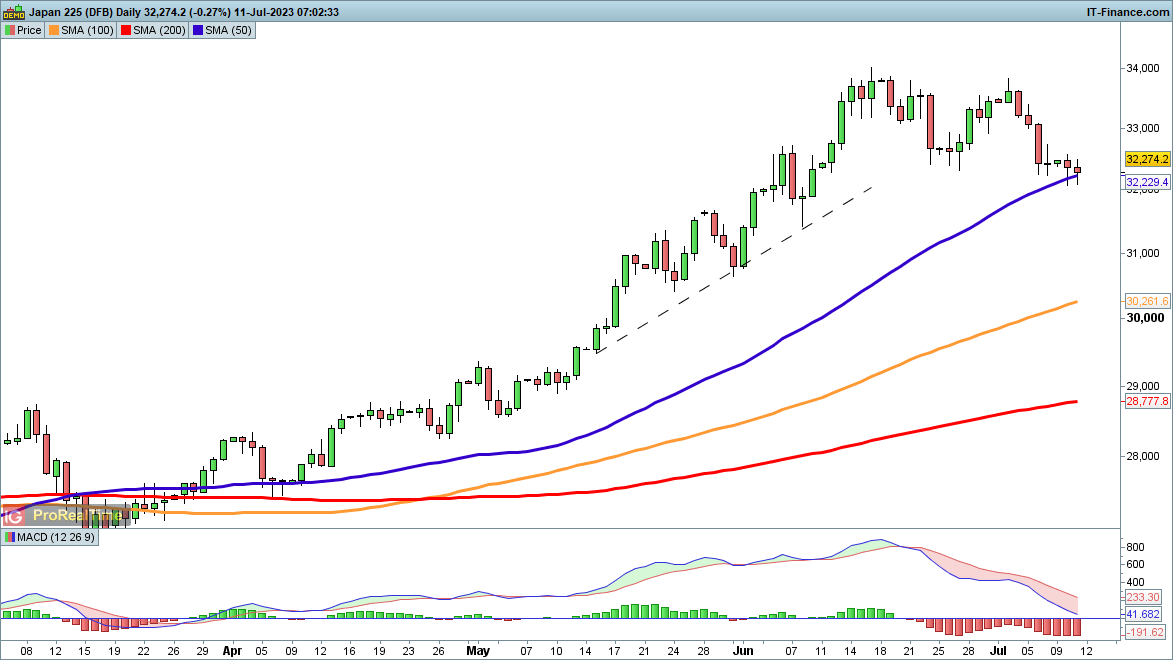
Nikkei 225 tests the 50-day moving average.
Having pulled back from 34,000, the index has stabilized around the 50-day SMA. A dip below this indicator found buyers on Monday, and while a higher low has yet to be formed, this first major pullback in months could see fresh buying pressure develop if the index can manage a close above 32,600.
This might then open the way to 34,000 and higher, reviving the uptrend. A close below 32,000 negates this bullish view.
Nikkei 225 Daily Price Chart
Comments are closed.