

WTI PRICE, CHARTS AND ANALYSIS:
Recommended by Zain Vawda
Download the Newly Released Q3 Forecast on Oil Now
Most Read: What is OPEC and What is Their Role in Global Markets?
Oil prices received a boost this morning following a lackluster Asian session on the back of weak Chinese PMI data. A host of comments crossed the wires this morning from the OPEC seminar in Vienna with Saudi Arabia’s Energy Minister leading the way.
GLOBAL PMI DATA CONTINUES TO DISAPPOINT, OPEC SEMINAR IN VIENNA
The Asian session saw Oil come under some selling pressure as the Chinese Caixin PMI data revealed a significant decline in both the composite and services PMI number. This adds China to the list of countries which have recently seen lackluster PMI data ramp up potential recessionary fears despite continued labor market tightness.

For all market-moving economic releases and events, see the DailyFX Calendar
Yesterday the US Institute of Supply Management (ISM) reported that the US is now on an 8-month contractionary period in the manufacturing sector as ISM data continues to languish below the 50 mark. As the global economy shows signs of a slowdown global Central Banks are expected to continue on their hiking cycles with market participants largely adopting a cautious approach in regard to Oil in particular.
This morning brought fresh comments from the Saudi Energy Minister among others at the OPEC Seminar in Vienna. The Saudi Energy Minister stated that markets will not be left unattended just a day after announcing the extension to production cuts for an extra month. Commenting on the announcement by Russia to cut exports the Minister confirmed that the cuts were voluntary and will be meaningful as it will have a direct impact on exports. The UAE Energy Minister on the other hand announced that the Gulf State will not be implementing any voluntary cuts at this stage without ruling out any in the future.
The recent cuts in production have not had the impact we saw from the March or June production cuts, which is likely down to fears that demand may falter in the second half of the year as the global economy continues to feel the impact of Central Bank tightening cycles.
Recommended by Zain Vawda
Latest Trade Ideas for Q3 from the DFX Team Available Now
ECONOMIC CALENDAR AND EVENT RISK
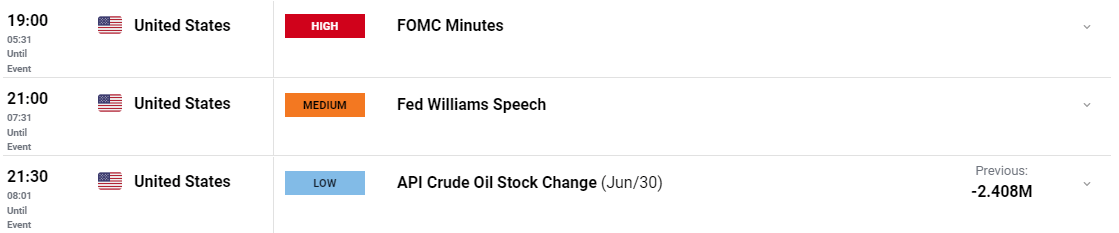
Federal Reserve policymakers will be keeping market participants on their toes today with the FOMC minutes release from the June meeting. There have been rumblings of late that there is some contention as to the path the Fed may need to follow for the remainder of 2023 and heading into 2024. The minutes may provide some clarity on where members stand and what to expect from the July meeting which is exactly three weeks away.
We will also get further insight into US Oil stockpiles with the API Crude Oil data due out which has been on a two-month streak of declines. A growth in inventories could potentially scupper today's rally just as it looks to gain momentum and may be worth keeping an eye on.
For all market-moving economic releases and events, see the DailyFX Calendar
TECHNICAL OUTLOOK AND FINAL THOUGHTS
From a technical perspective both WTI and Brent appear poised for further upside which could be upstaged by the macro picture playing out. WTI is attempting to break the 50-day MA as it attempts a run back toward the $75 a barrel mark.
Oil is currently trading within a symmetrical triangle pattern with a break of the 50-day MA likely leading to a retest of the top of the triangle pattern as well as the 100-day MA resting around the $73.70 a barrel mark.
Alternatively, a break and daily candle close below the symmetrical triangle could lead to a retest of the yearly lows around the $63.60 mark. However, for this to come to fruition support provided by the recent triple bottom pattern around the $67.10 handle will need to be broken and could prove a tough nut to crack.
WTI Crude Oil Daily Chart – July 5, 2023
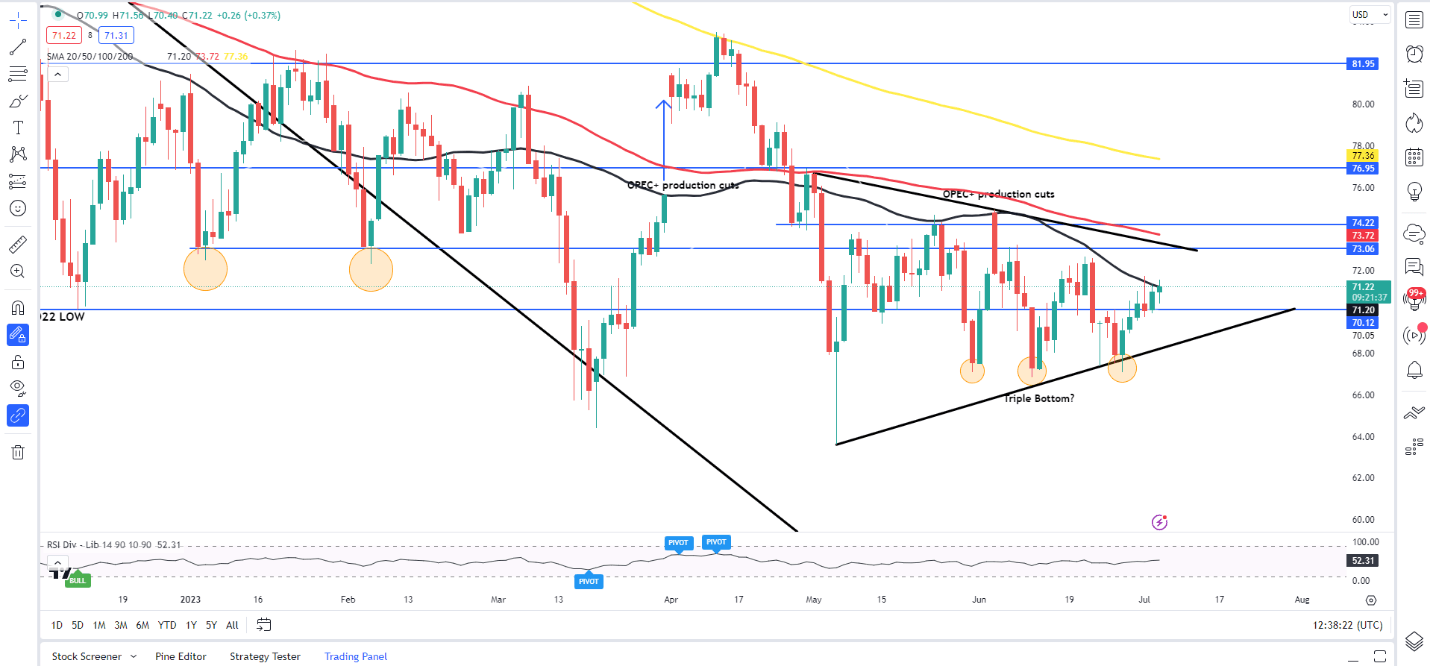
Source: TradingView
BRENT OIL
Looking at the technical for Brent and there are a few similarities with WTI but also a host of differences. Price is currently just trading above the 20 and 50-day MA with immediate resistance provided by the descending trendline which is a part of a larger triangle pattern in play.
Immediate resistance for now rests at the $77.00 handle with a break higher likely to facilitate a retest of the 100-day MA at $78.40.
Brent Oil Daily Chart – July 5, 2023
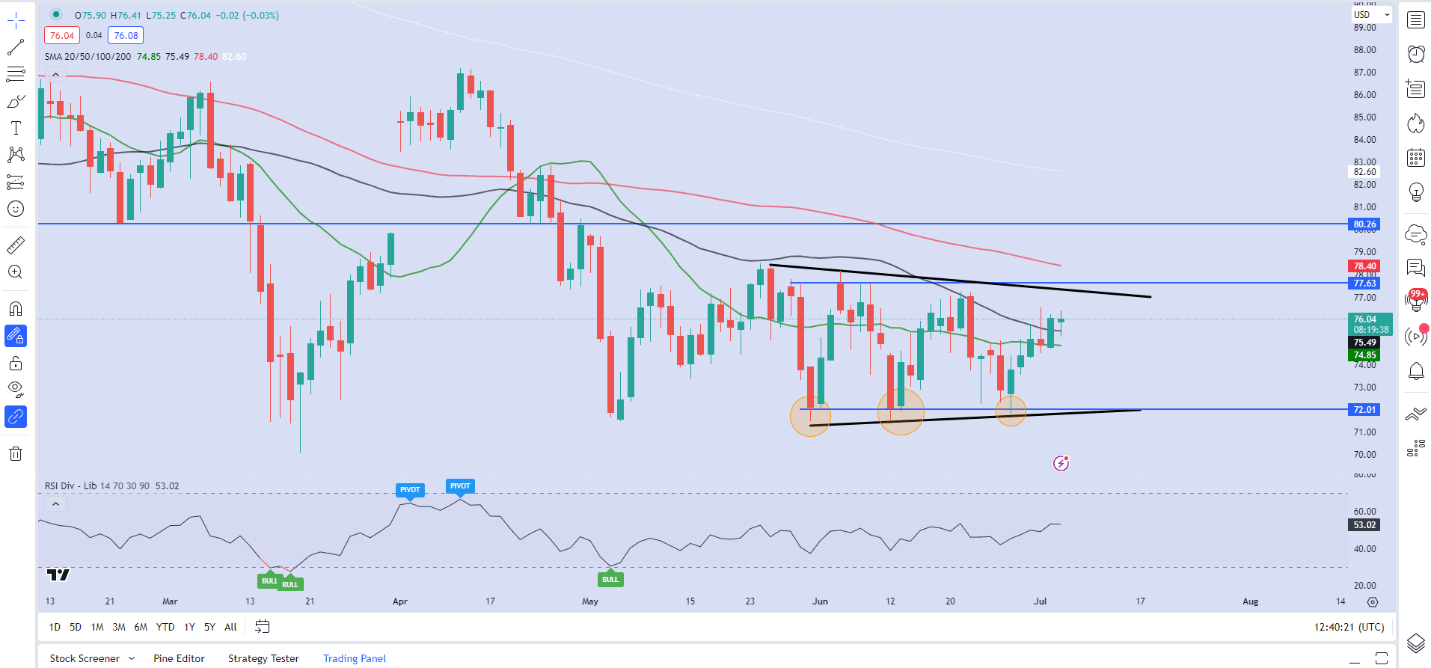
Source: TradingView
Trading Strategies and Risk Management
Market Conditions
Recommended by Zain Vawda
Written by: Zain Vawda, Market Writer for DailyFX.com
Contact and follow Zain on Twitter: @zvawda
Comments are closed.