Rand Rallies on Chinese Export Restriction
RAND TALKING POINTS
- Gallium and germanium could be two unknown but vital supporters for rand strength.
- South African PMI & FOMC minutes in focus tomorrow.
- Bear flag break imminent.
Trade Smarter – Sign up for the DailyFX Newsletter
Receive timely and compelling market commentary from the DailyFX team
Subscribe to Newsletter
USD/ZAR FUNDAMENTAL BACKDROP
The South African rand looks for its third straight day of gains against the U.S. dollar after Friday’s US Core PCE Deflator release missed estimates. In what would have been a relatively muted trading day today as the US celebrates Independence Day, China’s Foreign Ministry stated they would look to restrict certain chip making materials including gallium and germanium. These two little known substances could have major upside for the local currency as South Africa is one of the biggest germanium producers globally and gallium is produced in aluminum production (a capability South Africa holds). The demand for these materials would in theory rise in accordance with the Chinese decision to limit exports and should increase the demand for the rand.
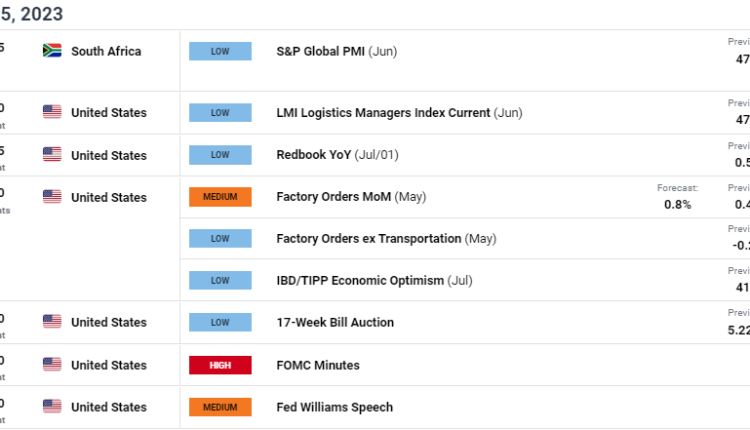
Other major South African commodity prices are trading higher today including gold and iron ore on the back of a weaker USD and with no significant economic data scheduled for today, I do not expect much in the way of price volatility before tomorrow. Tomorrow’s calendar (see below) begins with South African S&P PMI data which could track lower following the ABSA release yesterday. The primary focus will be the FOMC minutes and the thought process behind its members to keep rates on hold.
Foundational Trading Knowledge
Commodities Trading
Recommended by Warren Venketas
USD/ZAR ECONOMIC CALENDAR (GMT +02:00)
Source: DailyFX Economic Calendar
TECHNICAL ANALYSIS
USD/ZAR DAILY CHART

Chart prepared by Warren Venketas, IG
Daily USD/ZAR price action above shows a key channel (dashed black line) break being tested. A confirmation daily close below this support zone could spark a move lower towards the 18.5000 psychological handle. The pattern resembles that of a bear flag and the long upper wick formation on Friday could add to the downward bias short-term.
Resistance levels:
- 50-day moving average (yellow)
- 18.7167
- Flag support
Support levels:
Contact and followWarrenon Twitter:@WVenketas


Comments are closed.