Monitor your trades to Profit – Statistics – 4 July 2023
Monitoring your trades over time helps you build up your account balance and shows when you miss your goals. Traders on the MetaTrader platform have always wished for a functional Profit and Loss Calendar.
Viewing the closed trades of a symbol on the chart can help you adjust your strategy for better results.
Maintaining a trade book allows you to record the applied strategy and/or note the reason for taking each trade. It helps you to evaluate and refine strategies based on its profitability. A possibility to download the Account history as a text file with delimited fields, allows upload to MS Excel and helps create a Trade Book. Also, these downloads are required regularly.
| | Monitor your trades to Profit | |
The P&L Calendar expert advisor (utility) provides the above in a user-friendly interface. It makes use of the MetaTrader's pre-installed functions of being able to move the panel on the chart or minimize it when you don't need it.
|
The functionalities included are: Account Information Panel shows the following for you to take timely decisions:
P&L Calendar Panel shows a calendar view for all the closed trades of your account.
Download History allows the export of the account history to a text file.
View closed trades for symbol on the chart.
|
| | P&L Calendar – User Guide | |
This document details the functionalities and is also a guide on how to configure the indicator.
| Customize the Main Panel on startup |
You can select the Panel to be shown on startup. Accordingly, the other will be considered as a sub-panel.
![]()
P&L calendar makes use of the MetaTrader's pre-installed functions of Panels. The main panel can be minimized whenever you need to hide the display of both panels.
The sub-panel can be dragged with the mouse independent to the main panel, but when the main panel is moved, the sub-panel moves along with it on the chart. The close button on the sub-panel will close it, while the close of the main panel will remove the expert advisor from the chart. As the sub-panel is tied to the main panel, it will also close. You need to insert/re-drag the expert advisor back to the chart.
If P&L Calendar is the Main panel, you can click on ![]() to open the Account Information panel and click on
to open the Account Information panel and click on ![]() to close it.
to close it.
If Account Information is the Main panel then click on ![]() to open the P&L Calendar panel and click on
to open the P&L Calendar panel and click on ![]() to close it.
to close it.
| Panel – Profit & Loss Calendar |
P&L Calendar accesses the closed trades from your Account History and displays them as a monthly or yearly (per quarter or half yearly) calendar.
Month view of your profits
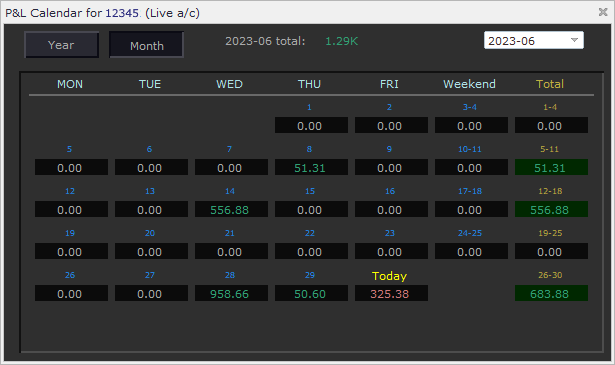
Clicking on the ‘Month' button displays the day-wise and week-wise totals of your closed trades for the month selected from the combo list ![]() The month total is also displayed. The current date totals are displayed as ‘Today'.
The month total is also displayed. The current date totals are displayed as ‘Today'.
The list of months shown in the combo starts from the earliest month retrieved from the account history to the current month.
NOTE: P&L Calendar EA will only display trades as shown in the Account History tab. To show all trades from history, you need to choose “All History” on right clicking on the tab.

Year view of your profits
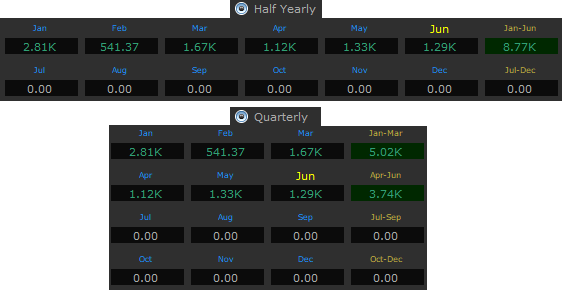
Clicking on the ‘Year' button will allow you to choose ![]() for the selected year from the combo list. The list of years are as retrieved from the account history of closed trades.
for the selected year from the combo list. The list of years are as retrieved from the account history of closed trades.
The month, half yearly, quarterly and year totals are also shown in the panel.
| Panel – Account Information |
The Account Information panel highlights the current status of your open positions to take timely action.
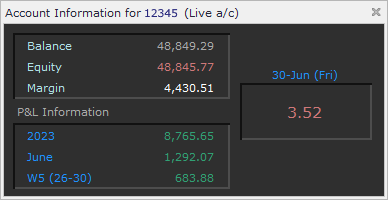
It show the Account Balance, the Equity balance and the Margin of the open positions. The panel also shows the P&L realtime summary for Year, month, week and today.
The Margin formatting can be customized by choosing the below options:

The colour for the Margin value will change once the defined threshold percentage of Account Balance is exceeded.
| Button – Download History |
Clicking on ![]() button, download the trades closed post the previous download. The details of the download are highlighted in a Message Box confirming the download. Any error will be displayed as an Alert.
button, download the trades closed post the previous download. The details of the download are highlighted in a Message Box confirming the download. Any error will be displayed as an Alert.
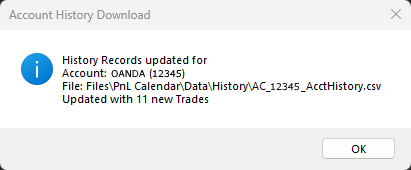
As the downloads are incremental the EA will check whether the trade is already existing in the download file and add it if missing. This will ensure that the trade exists in the file even if the Market Maker has archived it.
The EA allows you to the choose the delimiter used to seperate the fields in the text file. The available options are as below:

NOTE: Please do not change the delimiter once decided, as incremental downloads may encounter issues. Do take regular backups of the downloaded file.
The following are the details of a row in the text file:
| Button – View Closed Trades |
Click on ![]() button to view closed trades for symbol on chart and on
button to view closed trades for symbol on chart and on ![]() to hide them. The displayed line is shown from the trade open to close time. A tooltip displays the information for each trade.
to hide them. The displayed line is shown from the trade open to close time. A tooltip displays the information for each trade.
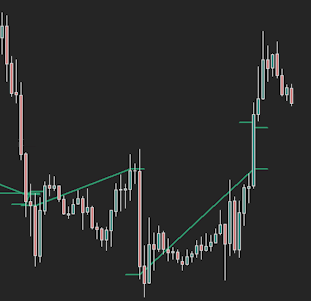

The styling of the line can be configured as below:
![]()
The line style has options as provided by MetaTrader. The Line thickness is defaulted to 1 in case the Line Style value is other than ‘Solid'.
Below explains on how you can configure the “Font and Color Settings” for the text and grid displayed on the panel
| |
Configure the font style and size of text displayed on the panel. |
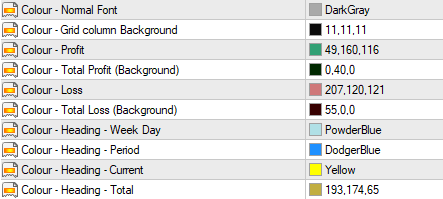 |
Configure the colours used for display of text and grid columns on the panel. |
- The indicator will show errors in “Journal” and “Experts” tabs of the terminal/toolbox (Ctrl+T) window.
Disclaimer: Past performance may not show future results. You cannot hold me responsible for use of the indicator or expert advisor and for any information provided in this document.

Comments are closed.