Cable bears eye 1.2600 region, focus on UK GDP, Fed’s favorite inflation
- GBP/USD seesaws around the lowest levels in two weeks, prods two-day downtrend of late.
- Bearish MACD signals, clear downside break of two-month-old horizontal support keep Pound Sterling bears hopeful.
- Multiple rising support lines, 100-EMA joins steady RSI to test Cable bears.
- Upbeat UK GDP, softer US inflation clues may allow Pound Sterling buyers to reprint 1.2600 on chart.
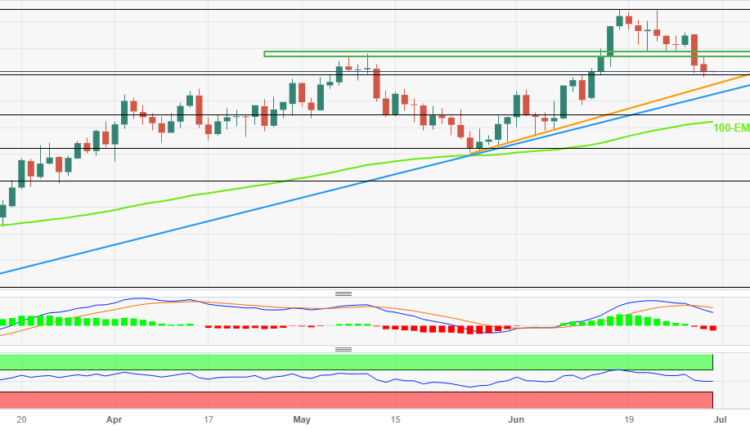
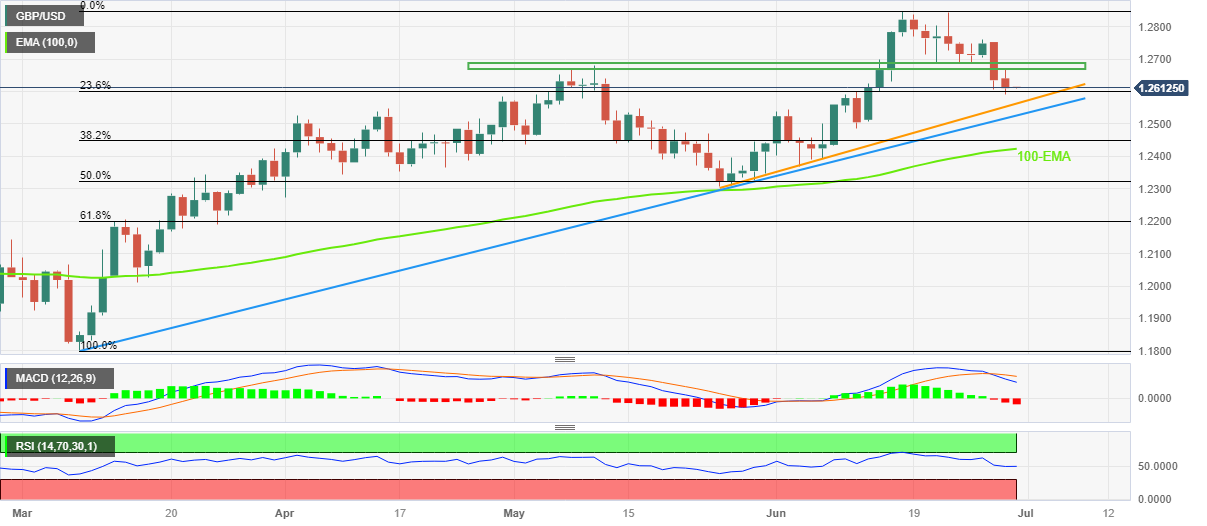
GBP/USD treads water at the lowest levels in two weeks, around 1.2610-1.2600 amid early Friday morning in Asia. In doing so, the Cable pair fails to justify the midweek’s downside break of the key horizontal support, now resistance, as well as the bearish MACD signals.
The Pound Sterling’s latest inaction could be linked to the market’s cautious mood ahead of the top-tier US and UK data, as well as the presence of ascending support lines from March and May, as well as the steady RSI (14) line.
Hence, the GBP/USD pair is likely to grind lower and suggests a battle with the ascending support line from March 08, around 1.2565, to be imminent.
The Pound Sterling’s weakness past 1.2565, however, isn’t an open invitation to the GBP/USD bears as a five-week-old rising support line, close to 1.2525, will precede the 100-day Exponential Moving Average (EMA), around 1.2420, to restrict further downside of the pair.
Meanwhile, the GBP/USD pair’s corrective bounce past the horizontal area comprising multiple levels marked since early May, between 1.2670 and 1.2690, appears a tough nut to crack for the Cable pair buyers during the corrective bounce.
In a case where the GBP/USD manages to remain firmer past 1.2690, the odds of witnessing a rally towards the yearly top marked in mid-June around 1.2850 can’t be ruled out.
GBP/USD: Daily chart
Trend: Further downside expected


Comments are closed.