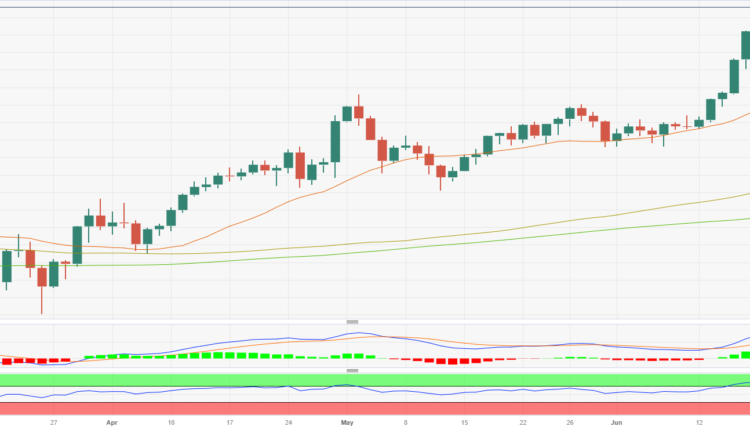
EUR/JPY hovers around 156.50, still showing overbought conditions
- EUR/JPY retreated below 156.30 area and then recovered to 156.55.
- Germany reported weak IFO index data making German Bond yields decline.
- Investors turn their attention to the European Central Bank's annual Forum in Sintra, Portugal.
At the beginning of the week, the EUR/JPY stabilized at 156.55. German IFO data from June came in below the consensus while investors' focus shifted to Wednesday’s speeches of main central bankers at the European Central Bank's (ECB) annual Forum in Sintra, Portugal. In that sense, most participants will look for clues regarding the next steps of the main bank's monetary policies.
Lower IFO data from Germany weakened the Euro. All eyes are now on the possible intervention of the BoJ.
The CESifo Group released IFO survey data from Germany in June, which acts as an early indicator of current conditions and business expectations for the next six months.he Business Climate Index came in at 88.5 vs the 90.7 expected, while the Expectations Index at 83.6 vs the 88 expected. The Current assessment lived up to expectations, coming in at 93.7, above the consensus of 93.5, but was lower than the previous month’s print.
As a result, German yields have weakened across the curve as investors have taken refuge in Bonds. The 10-year Bund yield fell to 2.31%, while the 2-year yield now sits at 3.14% and the 5-year is yielding 2.48%, after a 1.69% slide, respectively. On Tuesday and Wednesday, Christine Lagarde will deliver speeches, where investors will look to decipher the next steps of the ECB’s monetary policy.
On the other hand, according to a Reuters’ poll, the majority of the economists interviewed believe that the Bank of Japan (BoJ) will intervene to stop the Yen’s fall if the USD/JPY reaches 145.00. As for now, the pair trades at 143.15, and the JPY weakens amid soft inflation figures and the ultra-dovish stance by the BoJ.
EUR/JPY Levels to watch
Technically speaking, the EUR/JPY maintains a bullish outlook for the short term, as per indicators on the daily chart, but indicators still point at overbought conditions. The Relative Strength Index (RSI) holds a negative slope above 70, while the Moving Average Convergence Divergence (MACD) prints green but decreasing bars in its histogram.
A move above the 156.90 area would suggest a continuation of the bullish trend for EUR/JPY, with the next resistances at the 157.50 zone and psychological mark at 158.00. On the other hand, on the downside, the next support levels to watch are the 155.50 zone, followed by the 155.00 area and the 154.00 level.
EUR/JPY Daily chart
-638234023223929478.png)


Comments are closed.