What China’s Lackluster Stimulus Implies for Copper and the Aussie Dollar
How China’s Light Touch Stimulus Impacts AUD and Copper Prices
- The People’s Bank of China voted to cut benchmark lending rates by a meagre 10 basis points as the nation’s emergence from lockdowns has not gone to plan
- Copper is widely regarded as a leading indicator of economic health as warning signals reappear. Death cross in view as prices breach the 200 DMA
- AUD/USD surrenders gains at breakneck speed as China’s economic recovery stalls
- The analysis in this article makes use of chart patterns and key support and resistance levels. For more information visit our comprehensive education library
Recommended by Richard Snow
Building Confidence in Trading
China Provides Modest Support as The Economic Recovery Loses Momentum
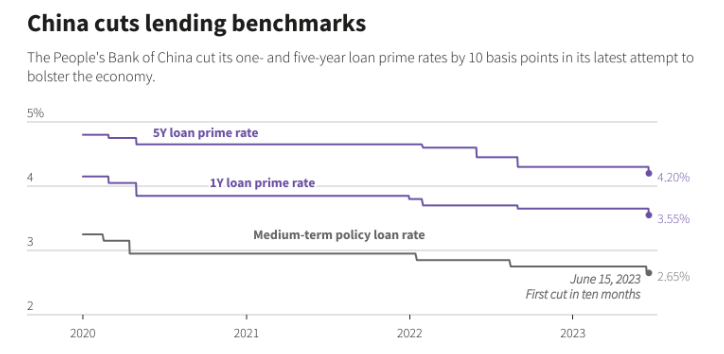
The People’s Bank of China (PBoC) decided to cut the 1-year and 5-year loan prime rate, less than a week after the medium-term policy loan rate received its first rate cut in 10 months. The measures were seen as necessary tweaks in an attempt to restimulate the economic recovery, although many, including markets themselves, appear skeptical of the effectiveness of the adjustments.
Source: Reuters, prepared by Richard Snow
Markets had not responded well to the decision, broadly interpreted as disapproval of the effectiveness of the policy change. The Heng Seng, Chinese SSE Composite Index and the Chinese Yuan all have traded notably weaker since the decision last Tuesday. Chinese assets appear at risk, particularly as fundamental data continues to sour. The chart below depicts the rise and sharp decline of China’s manufacturing industry – the main driving force behind the economic machine. The data dropped below 50, revealing that the Chinese manufacturing sector has entered a contraction.
China Manufacturing PMI (NBS)

Source: Reuters, prepared by Richard Snow
Market commentators and analysts foresee the possibility for a cumulative cutting of 25 basis points into year end but the Bank also has the option of lowering the reserve ratio requirement – allowing banks more freedom over capital to deploy into the real economy in an attempt to boost credit growth and spending.
Commodities Paint a Bleak Picture of the Global Recovery
The S&P Goldman Sachs Commodity Index (GSCI) reveals the steady downtrend in commodities, although, around half of that is due to drastically lower energy prices. Nevertheless, commodities tend to rise in price during economic boons and decline during periods of economic hardship.
S&P GSCI
Source: TradingView, prepared by Richard Snow
Copper, a leading indicator, appears to have turned sharply after a reluctance to close above the zone of resistance around 8650. Selling continued on Friday, closing below the March swing low of 8842 and tested the 200-day moving average. The next level of support appears around 8143 if the bearish move is to continue. The MACD index appears on the brink of achieving a bearish crossover so keep an eye on that in the next few trading sessions.
Copper Daily Chart

Source: TradingView, prepared by Richard Snow
Aussie Dollar Surrenders Sizeable Gains
The Australian dollar, alongside the New Zealand dollar, benefit to a great degree from trade with China via a concept known as the ‘core-perimeter model’. Therefore, when Chinese demand for Australian and New Zealand exports decline, this tends to play out in a broad sell-off.
Less demand from China means the Australian economy is likely to cool at a faster pace, helping to bring down inflation and end the rate hiking cycle. These dynamics favour a softer local currency, consistent with the move that has played out thus far.
AUD/USD has traded and closed below the 200 SMA and tests the long-term level of 0.6680 which conveniently appears midway through the broader zone that has contained the majority of price action over the last 4 months between 0.6580 and 0.6780. Continued pressure from worsening Chinese data or a decision from the RBA to pause interest rates again, could entertain a bearish continuation, with 0.6580 in focus. Resistance is still 0.6780 but a close below 0.6680 would see this level take over as the most relevant level of resistance.
AUD/USD Daily Chart
Source: TradingView, prepared by Richard Snow
— Written by Richard Snow for DailyFX.com
Contact and follow Richard on Twitter: @RichardSnowFX


Comments are closed.