
- GBP/USD bears are moving and eyes are on trendline support.
- Bulls are firming at a prior resistance structure on the daily chart.
GBP/USD bears have come into the market ahead of key economic data. UK labour market figures and UK Gross Domestic Product data will be up for grabs ahead of the US central bank interest rate decision. US Consumer Price Index will also be watched on Tuesday.
Meanwhile, technically, the market has dropped into a support area and the following illustrates prospects of a firmer test of the trendline support over the coming days.
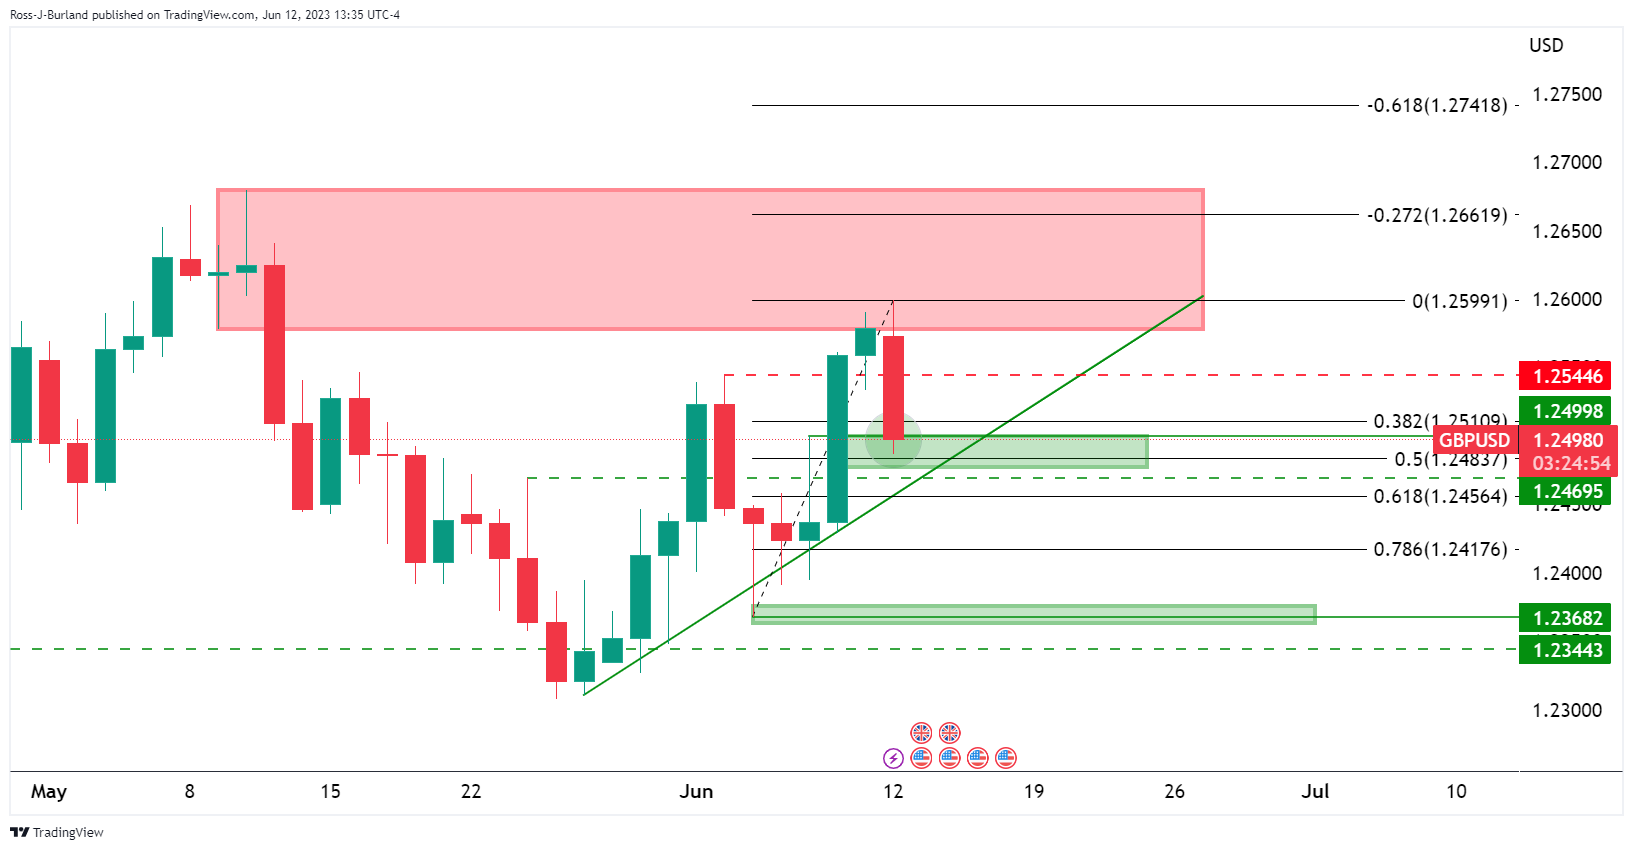
GBP/USD daily chart

The drop meets a prior area of structure on the daily chart that is now acting as support. This coincides with a 50% mean reversion area on the charts but it is still some way away from the trendline support area.
GBP/USD H4 chart
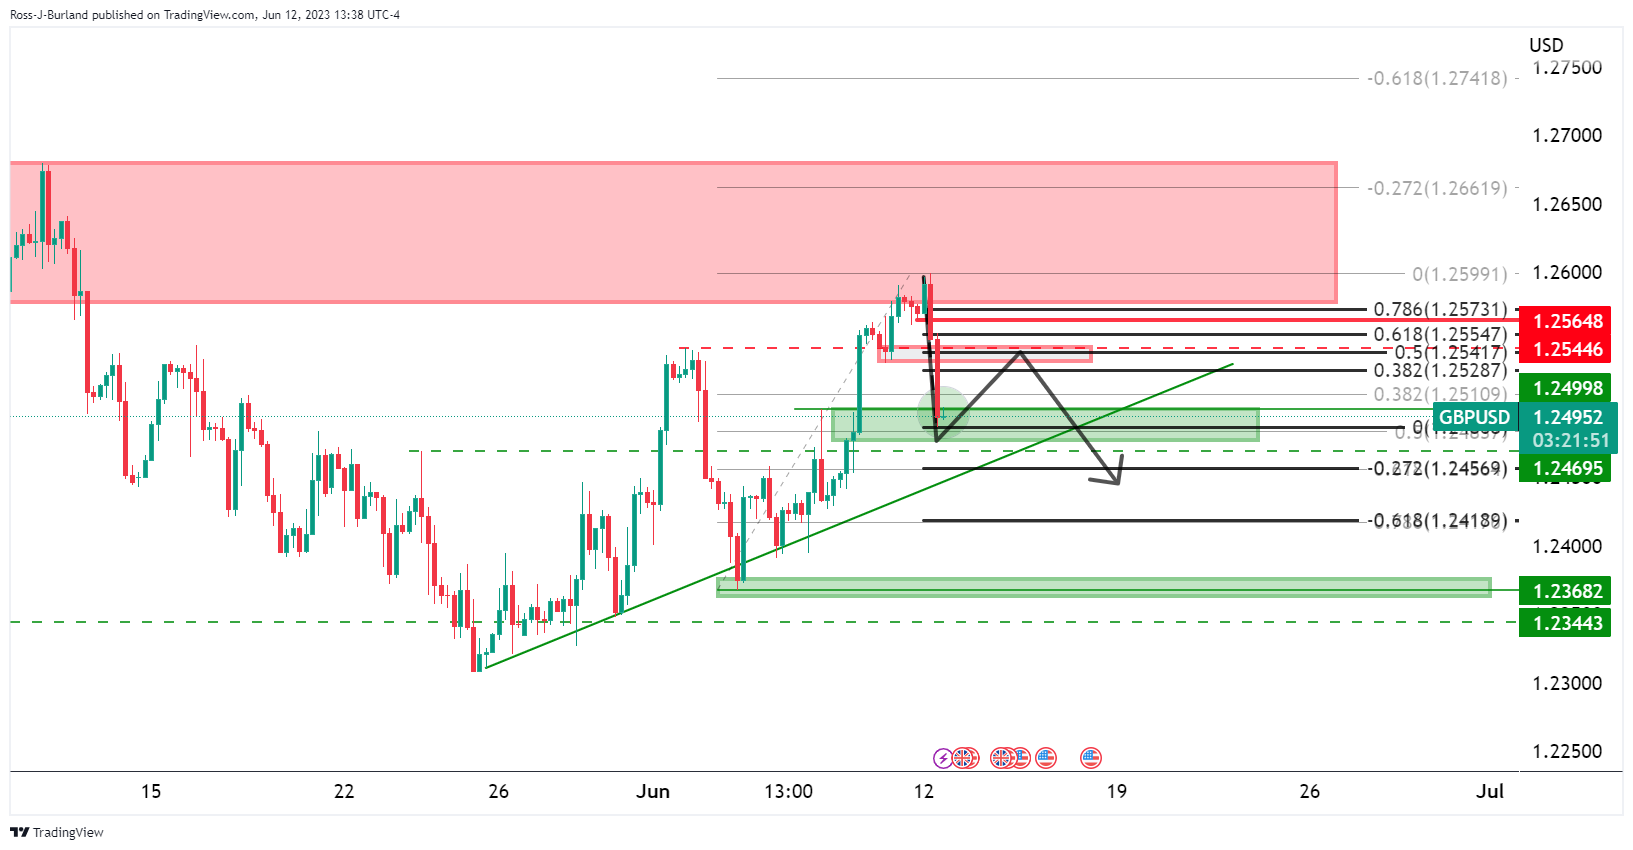
The 4-hour chart shows that there could be resistance in a 61.8% Fibonacci retracement before supply that could be the bear's last-ditch effort to take on the bullish commitments at the trend line support.
Comments are closed.