

Article written by IG Chief Market Analyst Chris Beauchamp
Dow Jones, Nasdaq 100, CAC40 Analysis and Charts
Dow makes headway in early trading
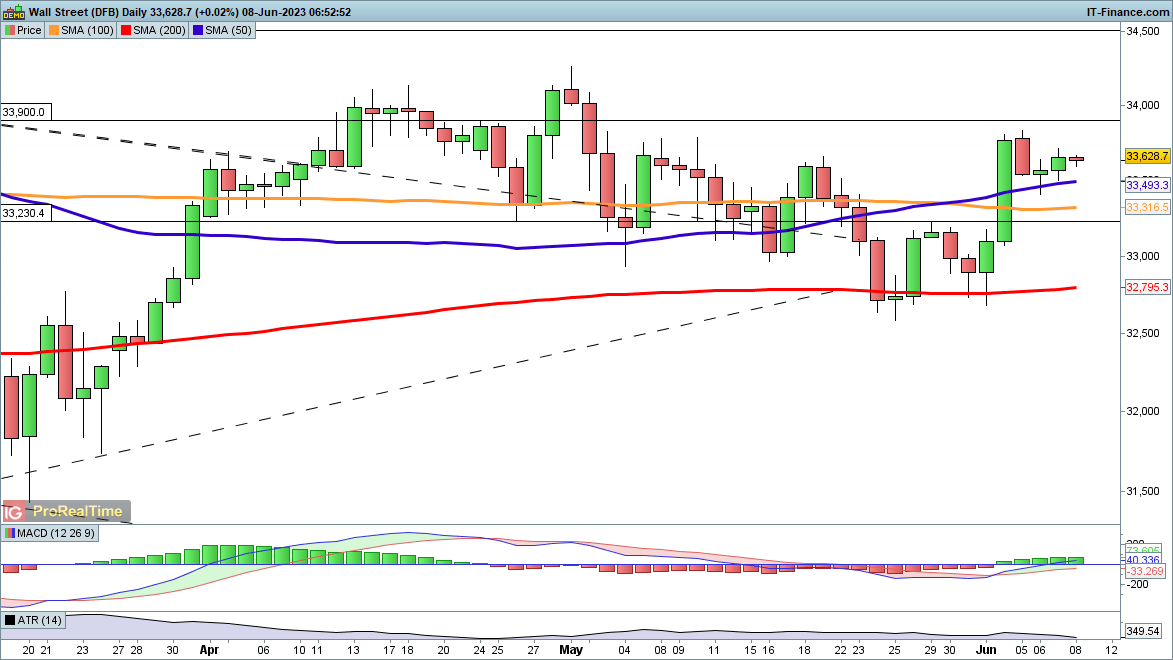
The price has managed to rise over the past two days, moving back above the 50-day SMA, bolstered in part by a recovery in oil stocks.
Gains faltered in early May around the 37,740 mark, so a move above here and then above 33,900 continues to build a bullish move, supported by the rising 50-day SMA and a bullish MACD.
A reversal back below 33,310 would negate this view and risk a return to the 200-day SMA and the lows of late May around 32,700.
Dow Jones Daily Price Chart – June 7, 2023
Recommended by IG
Traits of Successful Traders
Nasdaq 100 drops back from a one-year high
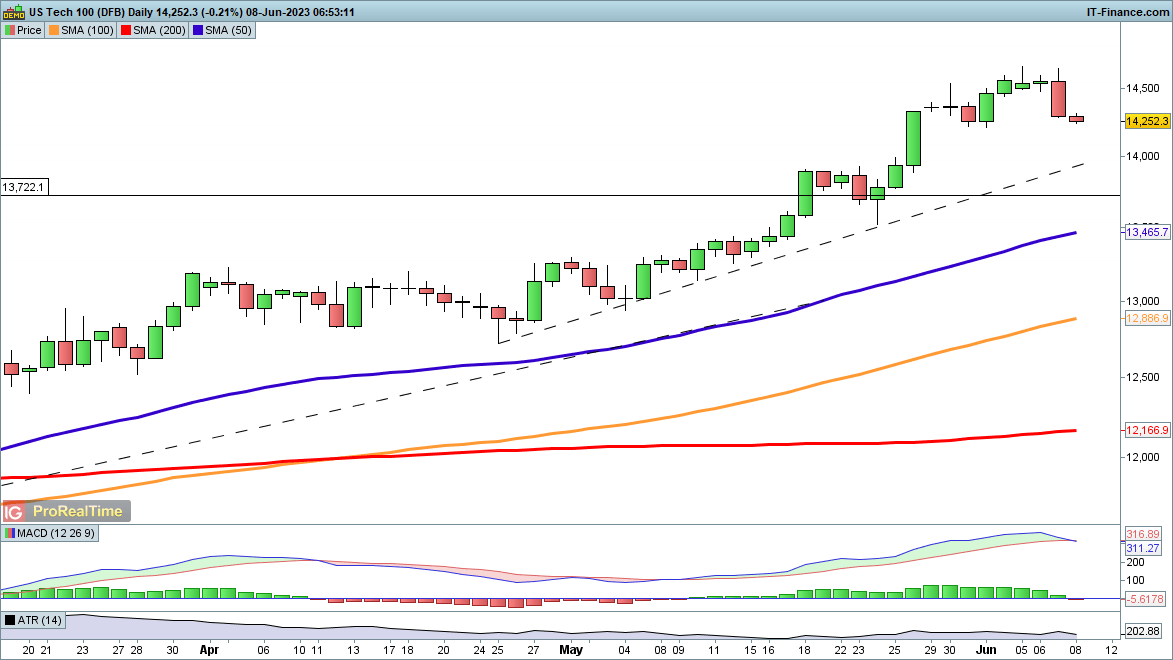
The move higher over the preceding four sessions was broadly negated by Wednesday’s losses.
This might point towards a reversal towards the 50-day SMA, though short-term trendline support from late April might also come into play around 14,000.
A reversal above 14,500 points the way to some fresh short-term upside.
Nasdaq 100 Daily Price Chart – June 7, 2023
CAC40 edges back above 7200
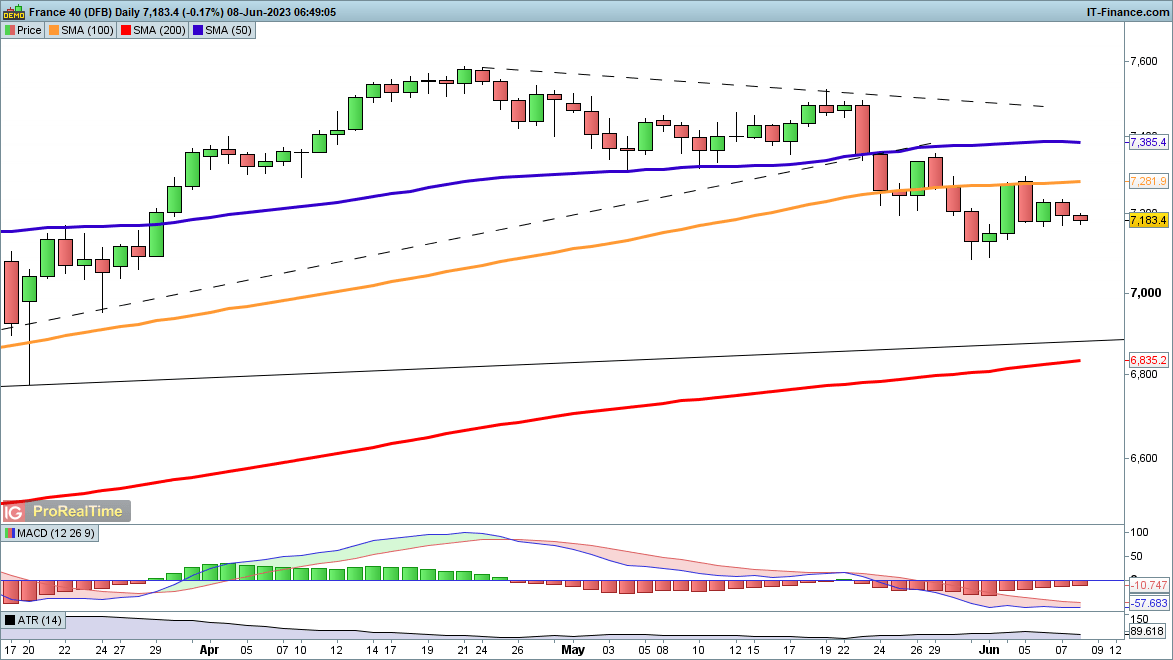
The index struggled on Wednesday as poor Chinese and German data, plus a rate hike by the Canadian central bank, prompted a risk-off mood to prevail in European markets.
However, it avoided a move below Tuesday’s lows, and this could provide the foundation for a move higher, with a move above 7300 likely to bolster the bullish outlook. The broader uptrend is still intact, so a higher low for the index would be a bullish development.
This view would be negated with a daily close below 7100.
CAC40 Daily Price Chart – June 7, 2023
Comments are closed.