
Trend warriors gather ’round!
May had been a good month for USD/CHF, which bounced from its .8850 lows to its current levels near .9150.
That’s a cool 300 pips in a few weeks!

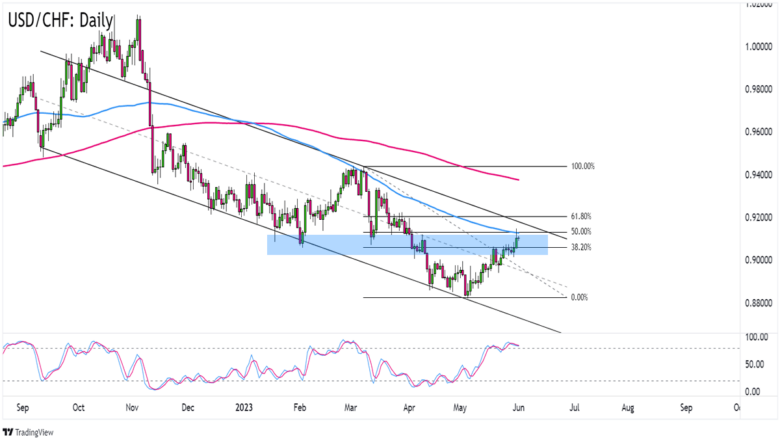
USD/CHF Daily Forex USD/CHF Daily Forex Chart by TV
What makes the setup interesting today is that USD/CHF is knocking at the 50% Fibonacci retracement of March and April’s downswing.
Not only is the 50% Fib near the daily chart’s 100 SMA resistance, it’s also not too far from a descending channel ceiling that hasn’t been broken since November last year!
Are we looking at a potential play to jump on USD/CHF’s downtrend?
Take note that yesterday’s candlestick closed with a long bearish wick. It also doesn’t hurt that USD/CHF is sporting a bearish divergence on the daily time frame.
Shorting at current levels or the first signs of bearish momentum would set you up for a cool win if USD/CHF ends up extending its downtrend and making new 2023 lows.
Convinced that USD/CHF’s upswing still has legs?
You can take advantage of the current green candlesticks and take short-term trades until USD/CHF sees some exhaustion.
Whichever bias you choose to trade, make sure you’re practicing your best risk management moves and following your trading plan like yo momma made it!
Comments are closed.