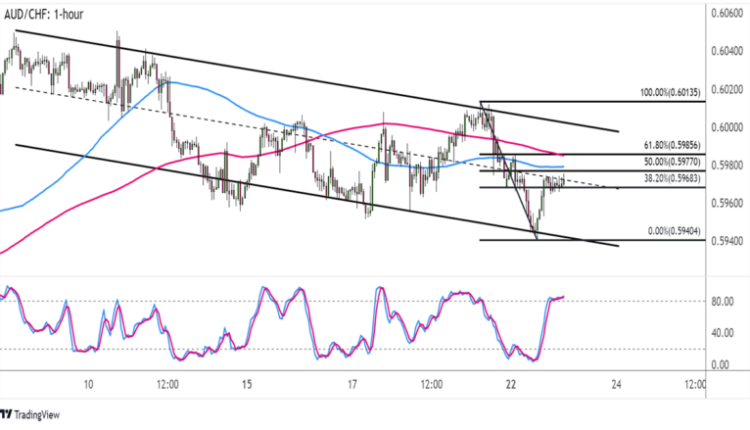
Chart Art: Trend Correction Levels on AUD/CHF
I’m keeping it simple with a textbook trend play on the hourly chart of AUD/CHF today.
As you can see on the chart below, the pair has been cruising inside a descending channel with its lower highs and lower lows.
Price is currently bouncing off support and might be in for a pullback to the channel top again.
Do you think these levels will still hold?

AUD/CHF 1-hour Forex Chart by TV
AUD/CHF is already testing the 38.2% Fibonacci retracement level that lines up with the mid-channel area of interest.
If this is enough to keep gains in check, the pair could resume the drop to the swing low around .5940 or the channel support.
A higher pullback could still make it up to the 50% Fib near the 100 SMA dynamic resistance or the 61.8% level at .5985. The line in the sand for a bearish correction might be the channel top that’s right smack in line with the .6000 handle.
Technical indicators are pointing to a continuation of the selloff, as the 100 SMA is below the 200 SMA to reflect downside momentum.
At the same time, Stochastic already made it to the overbought area to reflect exhaustion among buyers. Turning lower would confirm that sellers are ready to take over and allow the downtrend to resume.
There’s not much in the way of top-tier data from Australia or Switzerland this week, though, so AUD/CHF could just move to the tune of risk sentiment. In particular, a return in risk-off flows could mean another wave lower for the higher-yielding Aussie versus the lower-yielding franc.


Comments are closed.