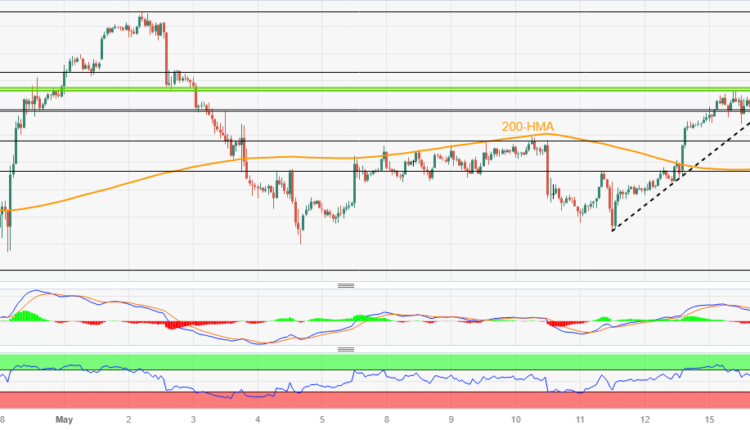
Snaps two-day uptrned near 136.00 on breaking immediate support
- USD/JPY remains pressured around intraday low as it reverses from two-week-old horizontal resistance.
- Downside break of ascending trend line from Thursday, bearish MACD signals favor Yen pair seller.
- 200-HMA appears the key hurdle for the Yen buyers to crack and retake control.
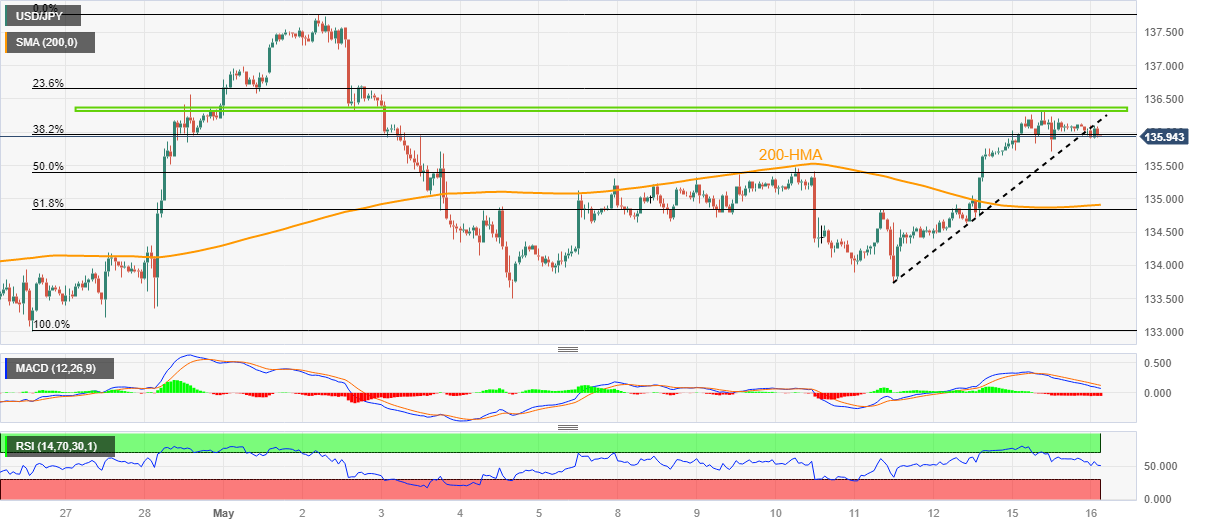
USD/JPY recalls the sellers after their two-day absence as the Yen pair drops to 135.95 during early Tuesday. In doing so, the Yen pair take a U-turn from a fortnight-long horizontal resistance, as well as break a three-day-old ascending support line, now immediate resistance.
In addition to the pullback from a short-term key resistance and a downside break of the nearby support trend line, the bearish MACD signals and a downward-sloping RSI (14) line, not oversold, also keep the Yen buyers hopeful.
With this, the USD/JPY pair appears all set to test the 50% Fibonacci retracement level of its April 26 to May 02 upside, near 135.40.
However, a convergence of the 61.8% Fibonacci retracement and the 200-Hourly Moving Average (HMA), near 134.90-85, appears a tough nut to crack for the Yen pair sellers.
Following that, the 134.00 round figure and the monthly low of around 133.50 will gain the USD/JPY seller’s attention.
On the contrary, USD/JPY recovery remains elusive unless breaking a horizontal resistance area comprising tops marked since April 28, close to 136.30-35.
Even if the Yen pair buyers manage to keep the reins past 136.35, the tops marked in May and March, respectively near 137.80 and 137.90, may prod the bulls before directing them to the 138.00 round figure.
USD/JPY: Hourly chart
Trend: Further downside expected


Comments are closed.