
S&P 500, SPX, NASDAQ 100, NDX – OUTLOOK:
- The uptrend in S&P 500 and the Nasdaq 100 index remains in place.
- Key focus is on the US debt ceiling negotiations and Fed speak this week.
- What is the outlook for the S&P 500 index and Nasdaq 100 index?
Recommended by Manish Jaradi
The Fundamentals of Range Trading
As the earnings season draws to a close, US equity markets are looking for positive catalysts which appear to be dwindling. Indeed, the checklist of negative factors cast a shadow over the multi-week uptrend. On technical charts, however, there are no signs of a reversal of the uptrend.
The most immediate worry for the markets is the US debt ceiling, perhaps more reflected in the options market, than spot. The open interest for VIX call options has surged to a five-year high, while the S&P 500 intraday range is the narrowest in months, and the realized volatility in the Nasdaq 100 index is the lowest since early 2022.
While this is not the first time the US has faced an impasse over the debt ceiling, the price action in the spot could be a sign of complacency that US lawmakers will eventually reach a compromise. The good news is that there is reportedly some progress in talks between the White House and the Republicans in Congress. “There’s real discussion about some changes we all could make,” President Joe Biden said on Saturday. “We’re not there yet.”
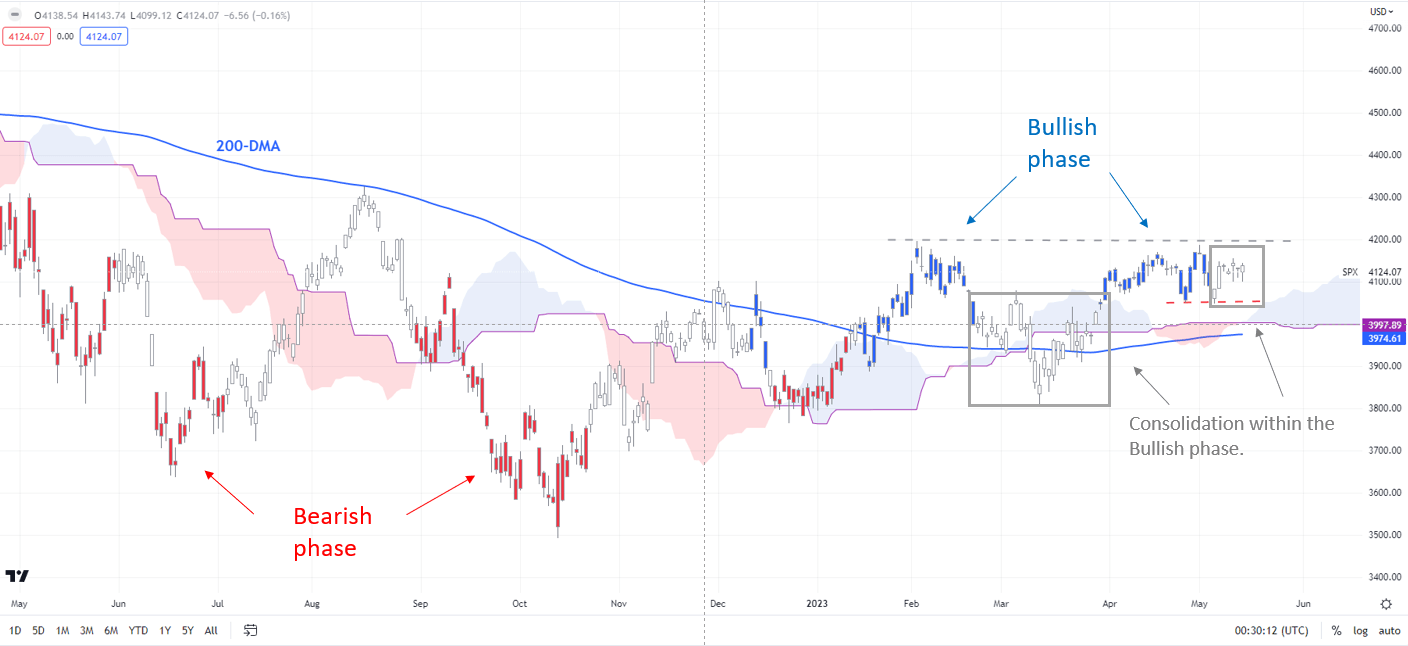
S&P 500 Daily Chart

Chart Created by Manish Jaradi Using Tradingview
Note: In the above colour-coded chart, Blue candles represent a Bullish phase. Red candles represent a Bearish phase. Grey candles serve as Consolidation phases (within a Bullish or a Bearish phase), but sometimes they tend to form at the end of a trend. Note: Candle colors are not predictive – they merely state what the current trend is. Indeed, the candle color can change in the next bar. False patterns can occur around the 200-period moving average, around a support/resistance, and/or in a sideways/choppy market. The author does not guarantee the accuracy of the information. Past performance is not indicative of future performance. Users of the information do so at their own risk.
Unless this time is different, the path to an eventual resolution could be bumpy, keeping investor and business sentiment in check. Already there are signs that businesses are beginning to feel the heat from tighter lending standards. Tighter credit conditions as a result of the turmoil in the banking sector are likely to hurt economic activity and hiring, raising the risk of a recession.
The market expects the US Federal Reserve to reverse some of the tightening, but the stickiness of price pressures raises the bar for rate cuts this year. In this regard, markets will be looking for cues from Fed’s Powell later this week. Having said that, despite the rising uncertainties, there are no signs of reversal on technical charts of the S&P 500 and the Nasdaq 100 index.
S&P 500 Weekly Chart
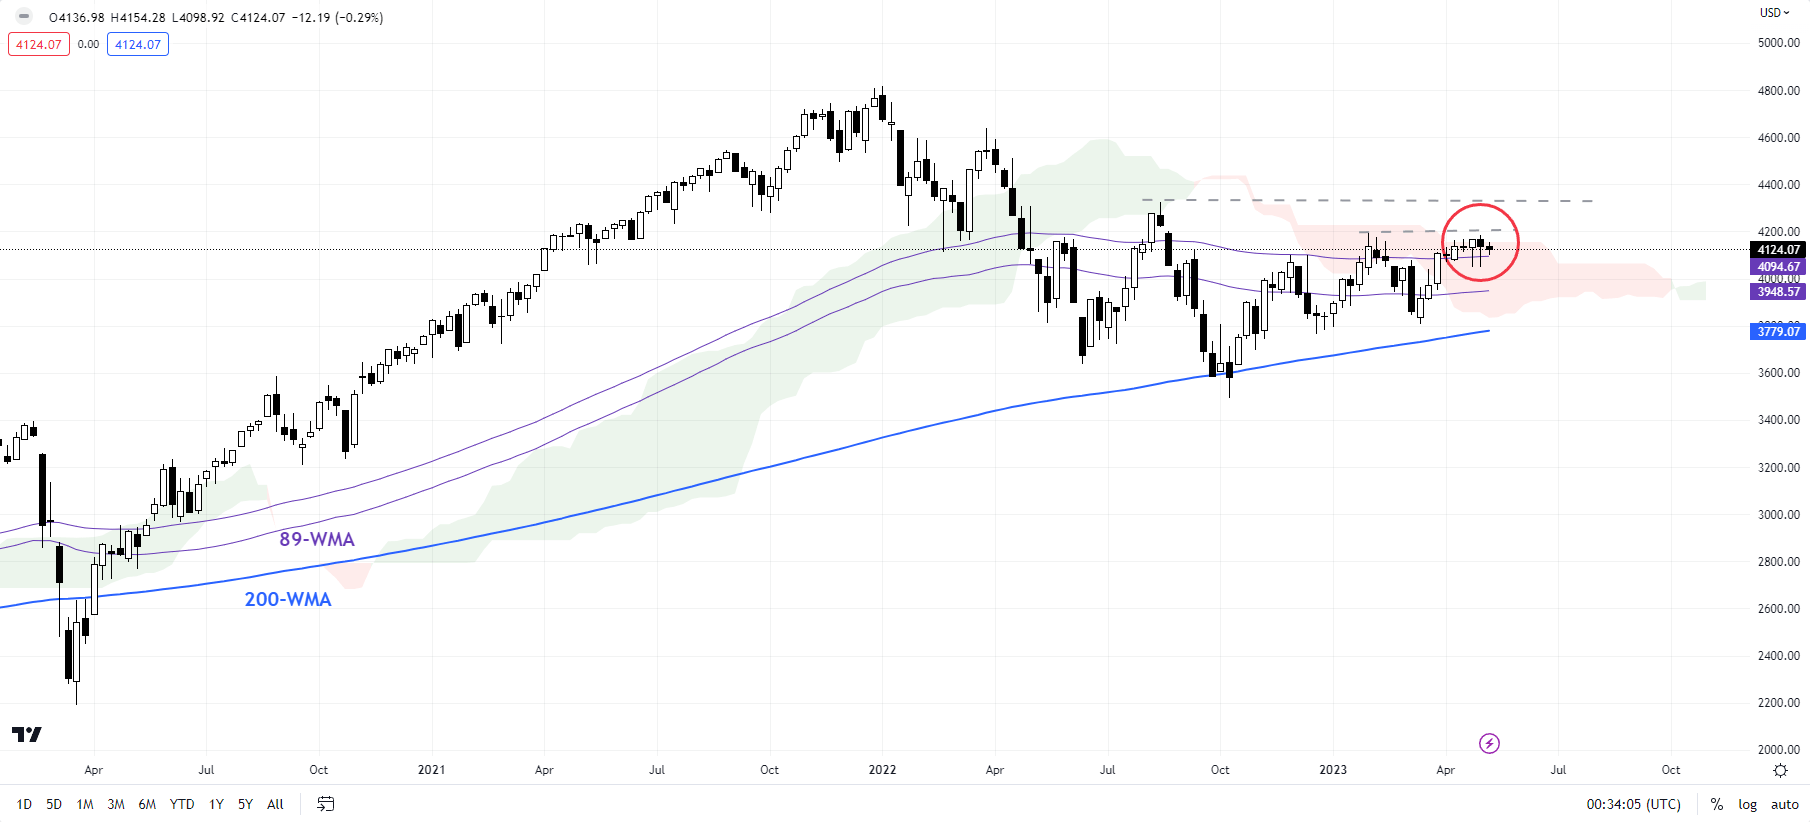
Chart Created by Manish Jaradi Using Tradingview
S&P 500: Rally stalls
The S&P 500 index’s broader trend remains bullish, as the colour-coded candlesticks charts show. Most recently, the index appears to be settling in a consolidation phase within the overall bullish structure, capped under a stiff hurdle at the February high of 4195. The index needs to cross above 4195 for the seven-month-long rebound to solidify.
Nasdaq 100 Daily Chart
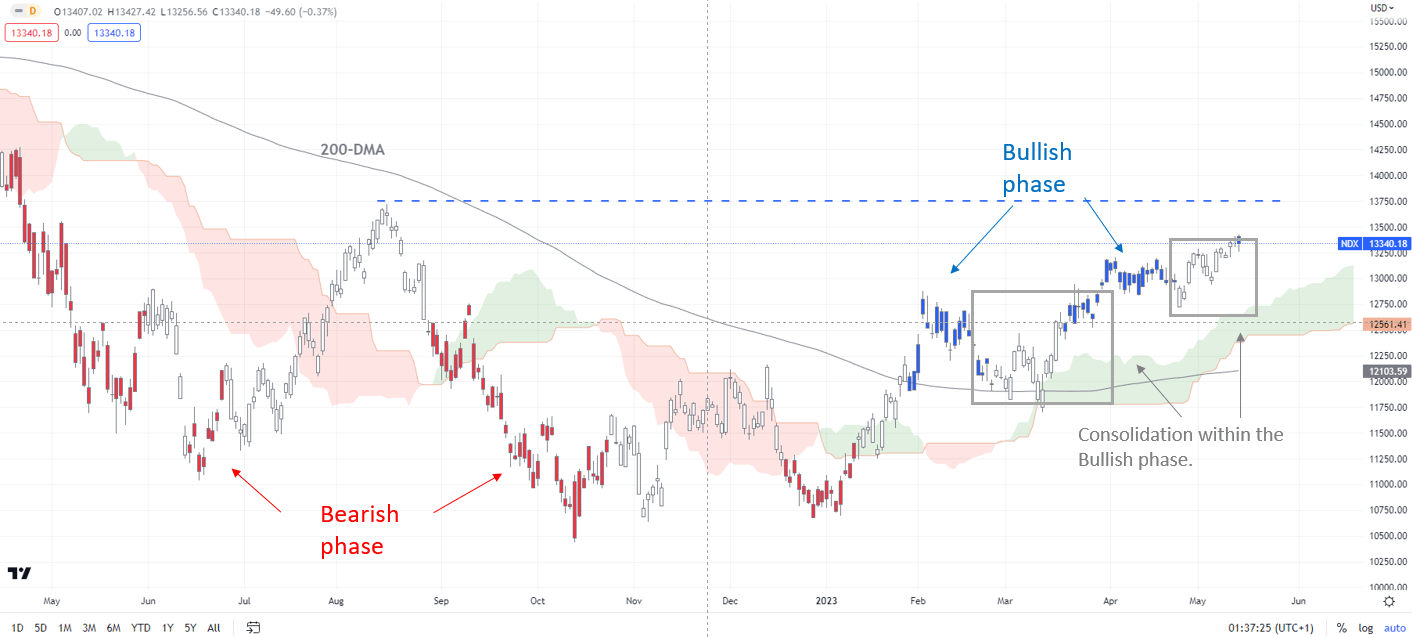
Chart Created by Manish Jaradi Using Tradingview
Note: In the above colour-coded chart, Blue candles represent a Bullish phase. Red candles represent a Bearish phase. Grey candles serve as Consolidation phases (within a Bullish or a Bearish phase), but sometimes they tend to form at the end of a trend. Note: Candle colors are not predictive – they merely state what the current trend is. Indeed, the candle color can change in the next bar. False patterns can occur around the 200-period moving average, around a support/resistance, and/or in a sideways/choppy market. The author does not guarantee the accuracy of the information. Past performance is not indicative of future performance. Users of the information do so at their own risk.
On the downside, there is crucial support at the end-April low of 4050. Any break below the support would confirm that the immediate upward pressure had faded somewhat, pointing to an extension of the consolidation phase. Still, there is a strong cushion on the 200-day moving average (now at about 3975). As highlighted in the previous update, only a break below the March low of 3809 would disrupt the higher-top-higher-bottom sequence from the end of 2022.
Nasdaq 100 Weekly Chart
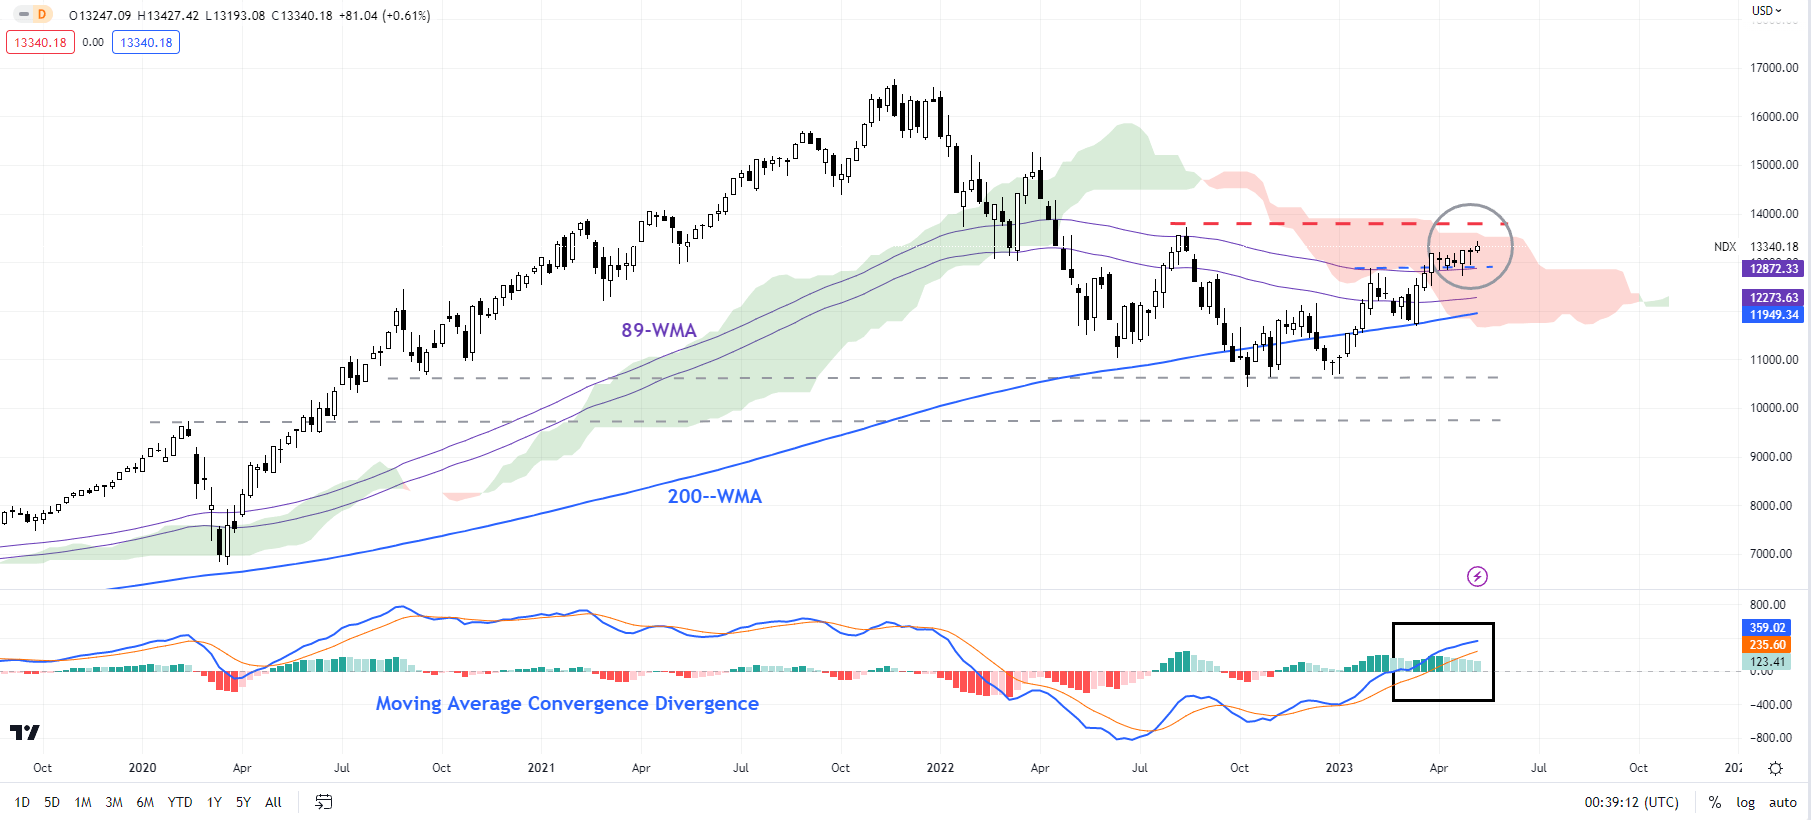
Chart Created by Manish Jaradi Using Tradingview
Nasdaq 100: Headed toward the August high
A fresh nine-month high reaffirms the uptrend in the Nasdaq 100 index, thanks to the surge in inflows into technology funds possibly triggered by a rotation out of the troubled financial sector. Moreover, the recent break above the early-April high of 13205 has cleared the path toward the August high of 13720. Despite the growing uncertainties, upward momentum remains altered – see the weekly chart.
Initial floor is at the April 25 low of 12725. Any break below could alleviate some of the upward pressure, but not necessarily alter the overall uptrend.
Recommended by Manish Jaradi
Traits of Successful Traders
Comments are closed.