

EUR/USD AND USD/JPY OUTLOOK:
- EUR/USD extends losses, sliding for the second day in a row ahead of key U.S. inflation data on Wednesday
- USD/JPY advances, but gains are modest, with the pair still wobbling after last week’s knockout punch
- This article looks at key technical levels to watch in EUR/USD and USD/JPY in the coming days
Recommended by Diego Colman
Trading Forex News: The Strategy
Most Read: GBP/USD Price Forecast – Anticipation Builds Around BoE Announcement
The U.S. dollar, as measured by the DXY index, extended its rebound on Tuesday, rising for the second day in a row amid a cautious mood on Wall Street ahead of U.S. debt ceiling talks and key inflation data, with Treasury yields holding their ground after a large rally in response to April's solid jobs report.
Against this backdrop, EUR/USD fell sharply in late morning trading in New York, down 0.54% to 1.0945, hitting its lowest level since April 19. Meanwhile, USD/JPY managed to eke out a small gain, up 0.10% to 135.20, with the pair still licking its wounds after a sharp sell-off early last week.
Below we analyze both EUR/USD and USD/JPY from a technical point of view in order to gain insight into possible directional moves based on price action and patterns.
Recommended by Diego Colman
Get Your Free EUR Forecast
EUR/USD TECHNICAL ANALYSIS
EUR/USD has been trapped inside a lateral consolidation channel since mid-April, with the exchange rate bouncing back and forth between the upper and lower limit of the recent range as displayed in the daily chart below.
After the pair’s pullback this week, prices appear to be approaching the lower bound of the interval located near 1.0920-1.0915, a key floor to keep an eye on. Bulls must defend this area at all costs, otherwise, sentiment could sour quickly, setting the stage for a drop toward trendline support at 1.0850.
Conversely, if EUR/USD resumes its recovery and reverses higher from current levels, initial resistance lies at 1.1090/1.1100. Bulls may struggle to drive prices above this barrier, but if they manage to clear this hurdle successfully, the path of least resistance may be a move toward the psychological 1.1200 mark.
EUR/USD TECHNICAL CHART
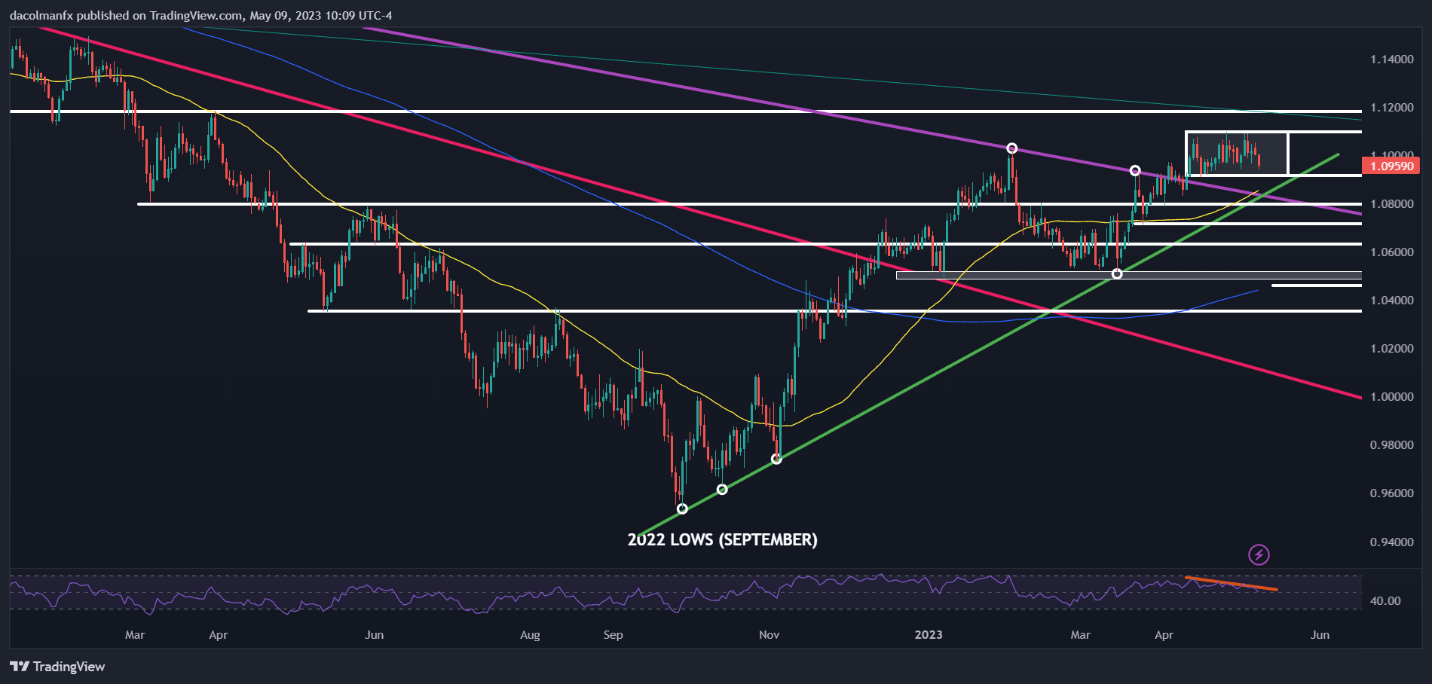
EUR/USD Chart Prepared Using TradingView
Recommended by Diego Colman
Get Your Free JPY Forecast
USD/JPY TECHNICAL ANALYSIS
USD/JPY fell sharply early last week, but encountered support near 133.85/133.75, where the 50-day simple moving average aligns with a short-term rising trendline and the 38.2% Fib retracement of the January/March rally. The pair subsequently bounced off of those levels, but has lacked bullish conviction.
While the near-term bias remains somewhat positive, to have confidence in a bullish outlook, bulls need to recapture the 200-day simple moving average at 137.00. If they accomplish this feat, buyers may become emboldened to launch an attack on the 2023 highs. On further strength, the focus shifts to 140.20.
On the flip side, if sellers regain control of the market and manage to breach the technical floor situated at 133.85/133.75, all bets are off. This bearish scenario could open the door to a major downside move toward 131.55 in short order.
USD/JPY TECHNICAL CHART
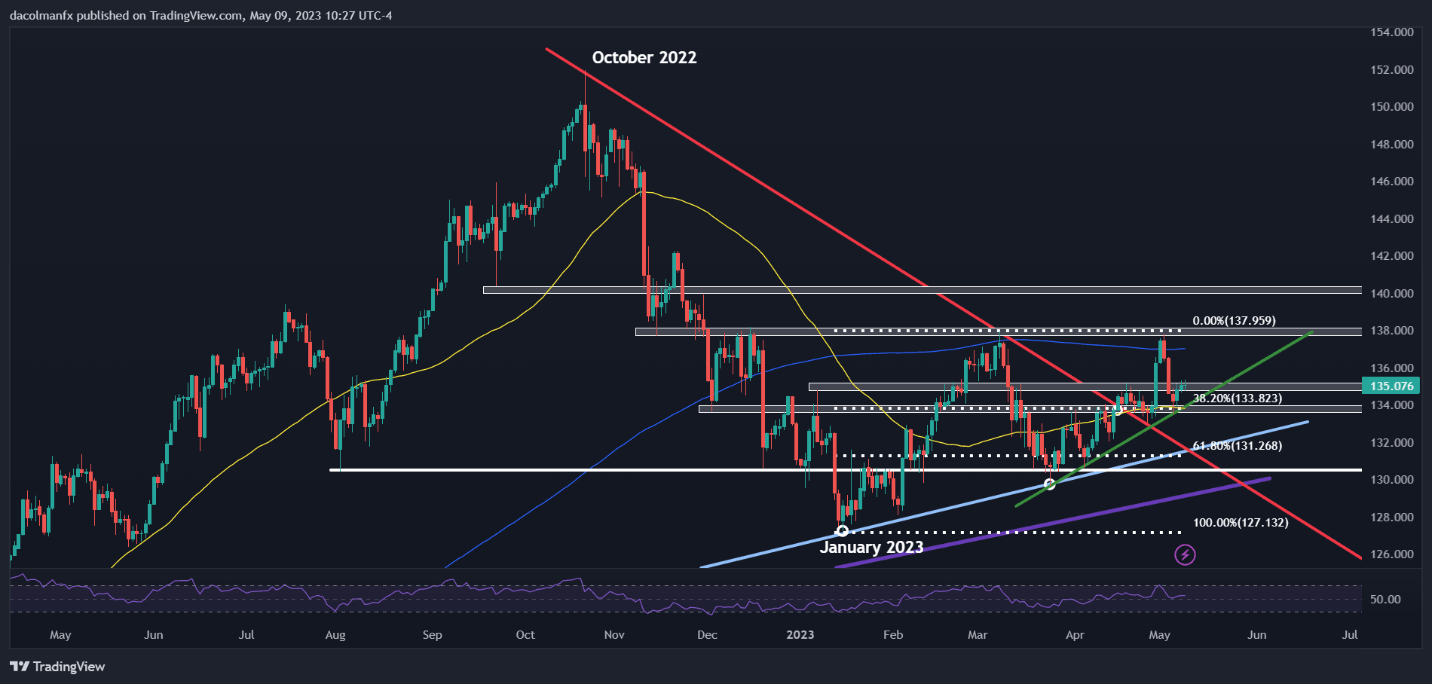
USD/JPY Chart Prepared Using TradingView
Comments are closed.