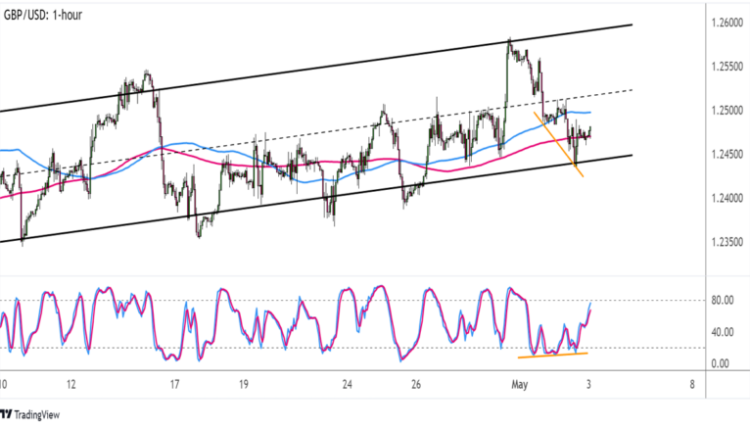
Chart Art: Bullish Momentum and Divergence on GBP/USD
Cable’s short-term uptrend is looking pretty solid right now!
Is it time to go with the flow with this bullish divergence forming?
As you can see from the chart below, GBP/USD has formed higher lows while Stochastic made lower lows, suggesting a buildup in upside pressure.

GBP/USD 1-hour Forex Charts by TV
In that case, the pair might be able to sustain its bounce off the ascending channel bottom and set its sights on the next resistance levels.
Pound bulls could aim for the top of the channel near the 1.2600 major psychological mark or at least the mid-channel area of interest at 1.2525.
Technical indicators are suggesting that there is a pretty good chance the uptrend could carry on. After all, the 100 SMA is above the 200 SMA while Stochastic has room to climb before reflecting exhaustion among buyers.
However, it’s also worth noting that the oscillator is closing in on the overbought region soon.
Also, GBP/USD is struggling to keep its head above the 200 SMA dynamic support, hinting that bearish vibes might be coming in play.
Just make sure you keep an eye out for long red candlesticks closing below the channel support around the 1.2450 minor psychological mark. This might be a sign that a reversal is due!


Comments are closed.