Chart Art: Bitcoin’s (BTC/USD) Long-Term Reversal in the Making?
Bitcoin (BTC/USD) just can’t bust through the $30,000 resistance!
Will it mean a longer-term reversal for the OG crypto?
Let’s take a look at the daily time frame:

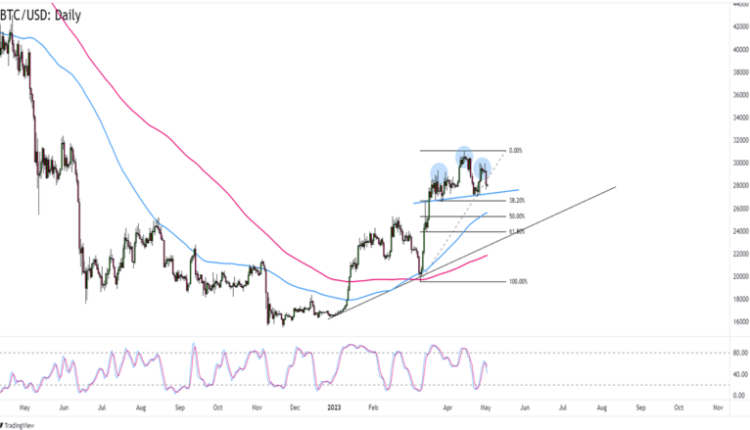
Bitcoin (BTC/USD) Daily Chart by TradingView
As you can see, BTC/USD has been knocking on the $30,000 major psychological area since mid-March when the pair bounced from its $20,000 support.
But the force is stronger on $30,000’s selling side and now BTC/USD is forming a possible Head and Shoulders pattern on the daily time frame.
Will continued rejection at $30,000 lead to a longer-term downswing? I’m keeping my eye on the $27,300 “neckline” that lines up with the 38.2% Fibonacci retracement of March’s upswing.
A clear breakout below the $26,700 – $27,500 area opens Bitcoin to a move to the $24,800 area of interest.
But if enough buyers show up around the “neckline” and $27,300 holds as support, then we could see another retest (and maybe an upside breakout?) of the $30,000 resistance.
If you’re planning on trading the pattern then you gotta prepare.
You can’t get knocked out of your trades because you didn’t know BTC/USD’s average volatility or you failed to account volatility spikes from FOMC and ECB’s policy decisions, amirite?
Whichever direction you choose to trade, make sure you’re using stop losses and following your trading plan.


Comments are closed.