XAG/USD struggles to break through 100-period SMA on H4
- Silver struggles to gain any meaningful traction and oscillates in a narrow band on Monday.
- The technical setup favours bullish traders and supports prospects for some intraday gains.
- A convincing break below the 23.6% Fibo. is needed to negate the near-term positive bias.
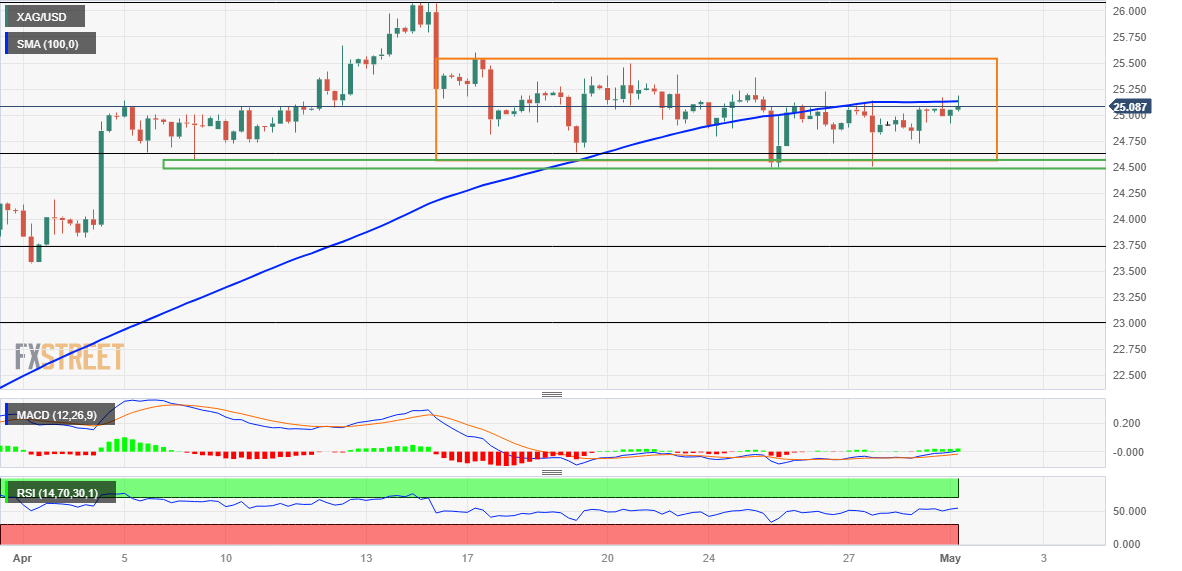
Silver reverses an intraday dip to sub-$25.00 levels and touches a three-day daily high during the early European session on Monday, though lacks follow-through. The white metal has been struggling to make it through the 100-period Simple Moving Average (SMA), warranting some caution for bullish traders and before positioning for an extension of the recent bounce from the $24.50-$24.40 horizontal support.
Looking at the broader picture, the XAG/USD is holding comfortably above the 23.6% Fibonacci retracement level of the March-April rally. Moreover, technical indicators on the daily chart maintain their bullish bias and have been gaining positive traction on hourly charts. This, in turn, supports prospects for some intraday appreciating move back towards the $25.50 supply zone. Some follow-through buying will negate any negative bias and pave the way for additional gains.
The XAG/USD might then make a fresh attempt to conquer the $26.00 round-figure mark and retest a one-year high touched on April 14. The positive momentum could get extended further towards the next relevant hurdle near the $26.25-$26.30 region en route to the 2022 swing high, just ahead of the $27.00 round-figure mark.
On the flip side, the $24.50-$24.40 region might continue to act as immediate strong support, which if broken decisively might prompt some technical selling. The subsequent downfall has the potential to drag the XAG/USD below the $24.00 mark, towards testing the 38.2% Fibo. level, around the $23.70 area. The corrective decline could get extended further towards the $23.35-$23.30 horizontal support before the metal drops to the $23.00 confluence, comprising the 50% Fibo. level and the 50-day SMA.
Silver 4-hour chart

Key levels to watch


Comments are closed.