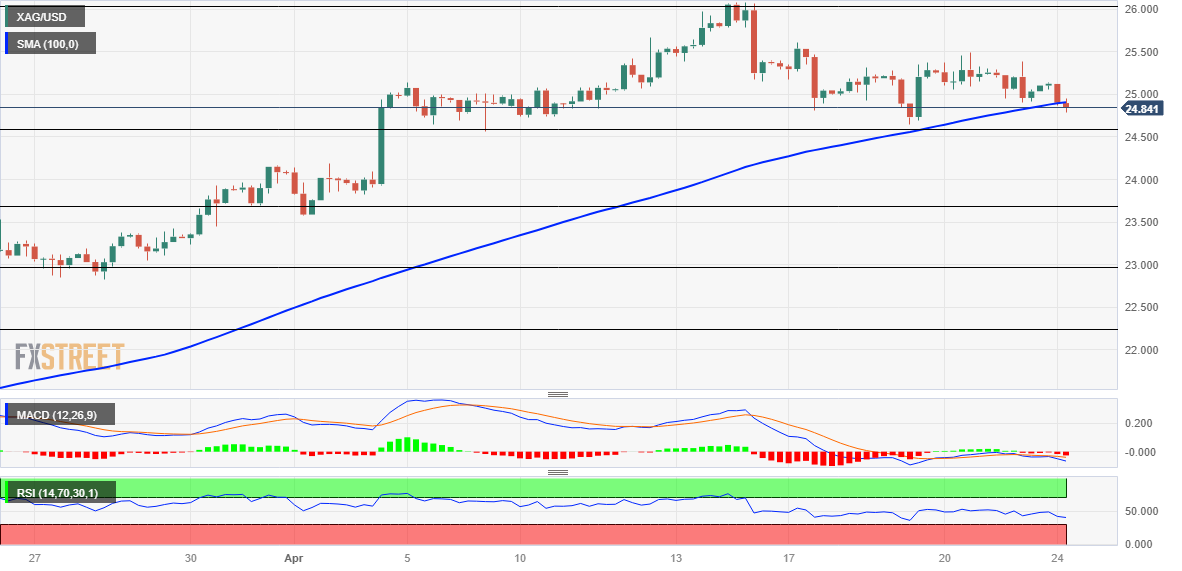
XAG/USD flirts with 100-period SMA on H4, 23.6% Fibo. holds the key
- Silver drifts lower for the second straight day, though defends 100-period SMA on the 4-hour chart.
- The mixed oscillators on hourly/daily charts warrant some caution before placing aggressive bets.
- A sustained weakness below the $24.40-30 area is needed to support prospects for deeper losses.
Silver remains under some selling pressure for the second successive day on Monday and drops to a three-day low, around the $24.80-$24.75 region heading into the European session.
From a technical perspective, the XAG/USD, so far, has managed to defend the 100-period Simple Moving Average (SMA) on the 4-hour chart. This is closely followed by the 23.6% Fibonacci retracement level of the March-April rally, around the $24.65 zone and the $24.40-$24.30 strong horizontal resistance breakpoint, now turned support.
With oscillators on hourly charts holding deep in the negative territory, a convincing break below the latter will set the stage for an extension of the recent pullback from a yearly peak, around the $26.10 region touched on April 14. The XAG/USD might then weaken further below the $24.00 mark and test the 38.2% Fibo. level, around the $23.70 area.
On the flip side, any intraday positive move back above the $25.00 psychological mark now seems to confront some resistance near the $25.20 horizontal level ahead of the $25.50-$25.60 supply zone. A sustained strength beyond will negate the negative bias and allow the XAG/USD to make a fresh attempt to conquer the $26.00 round-figure mark.
Some follow-through buying will mark a fresh bullish breakout and set the stage for a further near-term appreciating move. The next relevant hurdle is pegged near the $26.25-$26.30 region, above which the XAG/USD could aim to reclaim the $27.00 round-figure mark.
Silver 4-hour chart

Key levels to watch


Comments are closed.