How Much More Downside in New Zealand Dollar? Price Setup in NZD/USD, AUD/NZD, EUR/NZD
NZD/USD, EUR/NZD, AUD/NZD – Outlook:
- New Zealand CPI eased more than expected.
- Technical charts and relative monetary policy outlook suggest downside in NZD/USD could be limited.
- What are the key levels to watch?
Recommended by Manish Jaradi
How to Trade the “One Glance” Indicator, Ichimoku
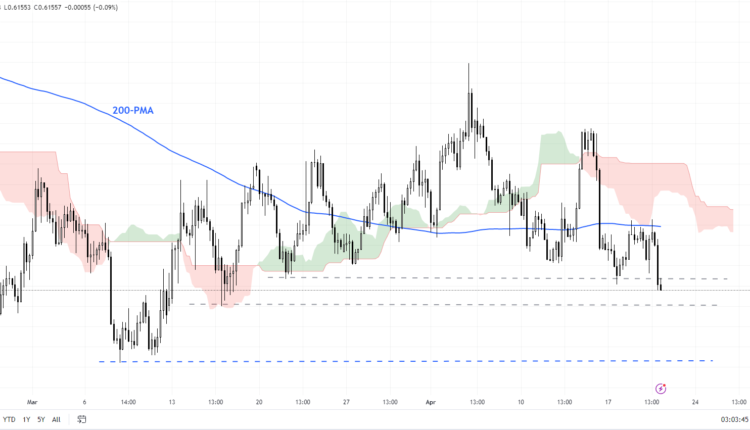
The New Zealand dollar has fallen sharply against the US dollar following a softer-than-expected inflation reading. However, relative monetary policy outlooks and technical charts suggest further downside in NZD/USD could be limited.
New Zealand inflation slowed more than expected in Q1-2023, softening to 6.7% on-year Vs 6.9% expected, down from 7.2% in Q4-2022. While inflation has eased, it may not be enough for RBNZ to press the pause button just yet. Money markets are pricing in one more RBNZ hike in May. Earlier this month, RBNZ raised interest rates by a bigger-than-expected 50 basis points while remaining hawkish as price pressures remain around three-decade highs.
NZD/USD 240-minute Chart
Chart Created Using TradingView
In contrast, the US Federal Reserve could pause sooner compared with the RBNZ (several policymakers considered holding rate increases at last month’s meeting) as US core inflation measures are stabilizing. Money markets expect the Fed to proceed with one more rate hike next month but expect the Fed to cut rates later this year. Unless the Fed turns incrementally hawkish or RBNZ turns dovish, the downside in NZD/USD could be limited.
NZD/USD Weekly Chart

Chart Created Using TradingView
NZD/USD: Strong support at the March low
Starting with the big picture, the lower high staged earlier this month indicates that the downward correction that started in February isn’t over yet (see the weekly chart). Earlier this month, NZD/USD failed to rise above crucial resistance on the 89-day moving average and the 89-week moving average, coinciding with the upper edge of the Ichimoku cloud cover on the daily and weekly charts.
NZD/USD Daily Chart
Chart Created Using TradingView
NZD/USD is now approaching quite strong support at the March low of 0.6085. Given the V-shaped rebound in the last quarter of 2022 (that is, a 100% retracement of the August-October slide), a hold above the vital floor at 0.6085 can’t be ruled out. Below 0.6085, the next support is at 0.6000 (the 50% retracement of the end of 2022 rise) followed by 0.5900 (the 61.8% retracement).
AUD/NZD Daily Chart

Chart Created Using TradingView
AUD/NZD: Key hurdle ahead
AUD/NZD’s break last week above key resistance at the early-April high of 1.0790 confirms that the downward pressure has faded for now. However, AUD/NZD has plenty of resistance, starting with the 89-day moving average, the upper edge of the Ichimoku cloud on the daily charts, and the 200-day moving average. For the outlook to turn bullish, AUD/NZD would need to break above the February high of 1.1085.
EUR/NZD Weekly Chart
Chart Created Using TradingView
EUR/NZD: Breaks higher
EUR/NZD’s break above key resistance at the October high of 1.7550 has opened the way toward the late 2020 high of 1.8225. The hold last year above the Ichimoku cloud on the weekly charts coupled with the break above the 200-week moving average confirms that the trend is up.
Trade Smarter – Sign up for the DailyFX Newsletter
Receive timely and compelling market commentary from the DailyFX team
Subscribe to Newsletter
— Written by Manish Jaradi, Strategist for DailyFX.com
— Contact and follow Jaradi on Twitter: @JaradiManish


Comments are closed.