Commodities Watchlist: Is Silver (XAG/USD) Gearing Up for a Reversal?
Watch out, silver bulls!
Precious metals have been on the rise lately, but it looks like the rallies might be running out of steam.
Is XAG/USD in for a selloff soon? Here are the levels to keep tabs on.

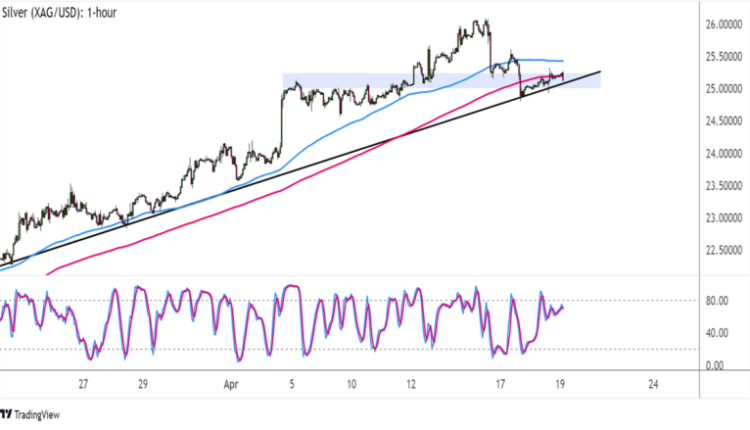
Silver (XAG/USD) 1-hour Chart by TradingView
Silver has been forming higher lows connected by an ascending trend line that’s been holding since late March, and price is currently testing this support zone.
A bounce could take XAG/USD back up to the highs around $26.00, but a break lower could signal that a downtrend is underway.
Now this lines up with an area of interest, which means that buyers and sellers often battle it out right here. Technical indicators are giving mixed signals on which side might win, though.
The 100 SMA is still above the 200 SMA to reflect the presence of bullish momentum, so there’s a good chance the trend line might keep losses in check.
Then again, the gap between the moving averages is narrowing to hint at slowing upside pressure and a potential bearish crossover. The commodity is trading below both indicators, so these could hold as dynamic resistance levels.
Also, Stochastic is starting its descent from the overbought zone, so silver prices could follow suit as selling pressure picks up.
A break below the $25.00 level would create a complex head and shoulders pattern, too, giving more reason for sellers to jump in.
Better keep an eye out for a surge in risk-off flows that could spur a selloff for risk assets like silver!
This content is strictly for informational purposes only and does not constitute as investment advice. Trading any financial market involves risk. Please read our Risk Disclosure to make sure you understand the risks involved.


Comments are closed.