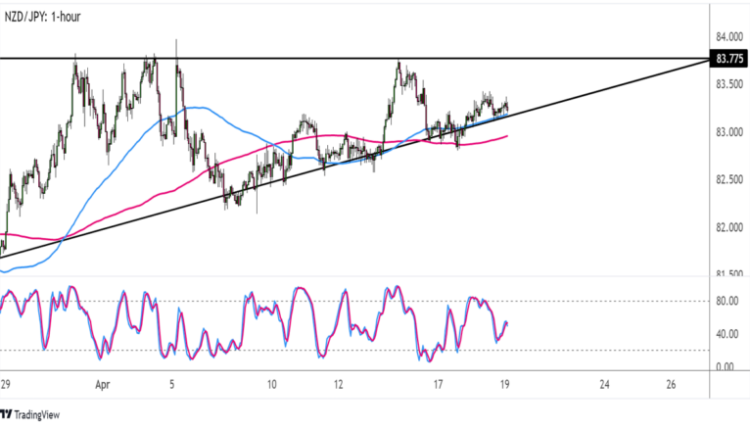
Chart Art: NZD/JPY Triangle Support Test
NZD/JPY is currently in consolidation mode inside an ascending triangle pattern.
Will we see another bounce or a breakout soon?
Better keep your eyes on these levels if you’re hoping to catch a big move!

NZD/JPY 4-hour Forex Chart by TradingView
This forex pair is currently testing the bottom of its triangle pattern, still deciding where to go next.
Technical indicators seem to be pointing to a bounce, which might take price back up to the resistance just below the 84.00 major psychological mark.
The 100 SMA is above the 200 SMA to reflect upside pressure, and this shorter-term moving average is also holding as dynamic support at the triangle bottom.
Stochastic is heading north, so NZD/JPY could follow suit while bullish momentum is present. The oscillator has room to climb before reflecting exhaustion among buyers, too.
However, it’s also worth noting that the pair has formed lower highs recently and has made several attempts to break below support.
If sellers finally gain the upper hand now and spur a break below the 83.25 area, we might just see a selloff that’s at least the same height as the chart pattern.
That’s around 200 pips yo!
Don’t forget that New Zealand has its quarterly CPI report up for release soon, and this figure could determine whether or not the RBNZ can keep up its aggressive pace of tightening.
Number crunchers are projecting a slight pickup in the quarterly rate from 0.4% to 0.6%, but this might not be enough to keep the year-over-year reading from slowing down to 7.0%.
Weaker than expected results could dash hopes for another big RBNZ rate hike, which might bring some downside for the Kiwi, but an upside surprise could trigger a strong rally.


Comments are closed.