Commodities Watchlist: Copper Reversal Gaining Traction
After that upside trend line breakout, it looks like copper is going for more gains!
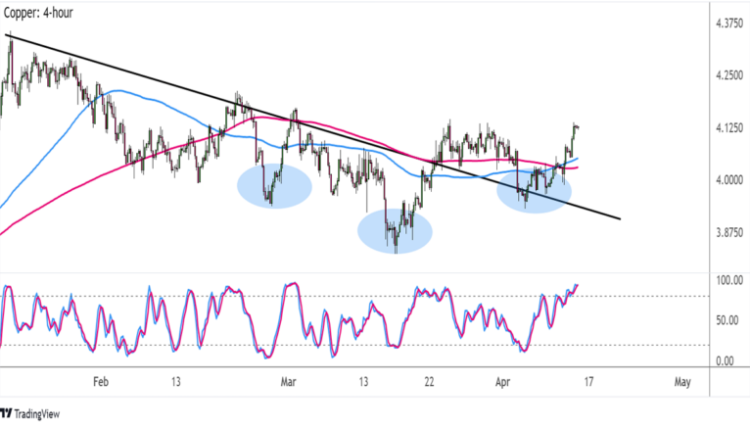
Check out this reversal chart pattern on its 4-hour time frame.

Copper 4-hour Chart by TradingView
Not only did the commodity price break above a descending trend line and complete its retest, but it’s also forming an inverted head and shoulders pattern, too!
Does this mean that a big copper rally is in the works?
Moving averages seem to think so, as the 100 SMA made a bullish crossover above the 200 SMA to confirm that buying pressure is building up.
Stochastic is also on the move up, but the oscillator is already in the overbought zone to signal that buyers might need a break soon.
If that’s the case, copper might be in for a quick pullback to nearby support zones – possibly around the dynamic support at the moving averages – before heading any higher.
Either way, a break above the neckline resistance at $4.1250 could trigger an uptrend that’s at least the same height as the reversal formation, so watch out for that!
Copper prices are once again on the rise, thanks to mostly upbeat data from China that could be indicative of a boom in demand for metals. Earlier in the week, the world’s top buyer of copper reported a surprise surge in exports, suggesting that the economy is doing waaay better than expected.
Meanwhile, supply remains constrained according to LME data, which has been reflecting a downward trajectory in inventories and has slumped to lows not seen since 2005.
How high do you think copper prices might go from here?
This content is strictly for informational purposes only and does not constitute as investment advice. Trading any financial market involves risk. Please read our Risk Disclosure to make sure you understand the risks involved.


Comments are closed.