Weekly Technical Outlook: Trend Continuation Trades for TSLA, Ether (ETH/USD), and GBP/USD
Trend warriors gather ’round!
If you’re looking for trend setups to trade in the next few days, then you won’t want to miss what’s cooking on Tesla, Ether, and Cable’s charts.
Get ’em while they’re hot!

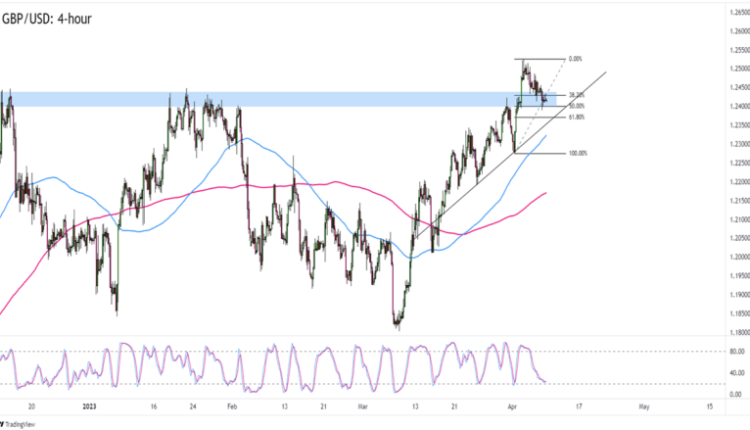
GBP/USD 4-hour Forex Chart by TradingView
I don’t know if you’ve noticed but GBP/USD recently broke a key resistance area!
Cable hit a high near 1.2525 last week before GBP bears stepped in and dragged the pair back to its 1.2400 prices.
As you can see, GBP/USD’s current levels line up with a key resistance zone from late 2022 and early 2023. Not only that, but it’s also near the 50% Fibonacci retracement of last week’s upswing.
Coincidence? Only if you want it to be! Buying at early signs of bullish momentum will make for a good trade especially if GBP/USD revisits last week’s highs.
If you’re not too confident about GBP gaining more pips against USD, then you can also take advantage of the current downswing or wait for a break below the trend line and 100 SMA support before pricing in your bearish biases.

ETH/USD Daily Chart by TradingView
Ether (ETH/USD) has been showing us higher highs and higher lows since seeing an upswing in March!
The pair recently hit a resistance near $1,945 and is now trading closer to the $1,850 area of interest.
Can ETH extend its gains? Or will Ether take a breather?
The ascending channel and 100 SMA remain intact as support so it’s still reasonable to expect an extension of an uptrend.
A long trade at current levels or somewhere a bit closer to the channel support looks legit as entry points if you’re anticipating ETH/USD hitting higher highs in the next few days.
Tesla, Inc. (TSLA): Daily

Tesla, Inc. (TSLA) Daily Chart by TradingView
TSLA is a long way up from its 2023 lows, but the stock is having trouble making new highs above the $200 mark.
Not surprising since the area is a key inflection zone in late 2022. This time around, the $175 – $200 area also lines up with the Fibonacci retracement levels. It’s also not far from the daily time frame’s 100 and 200 SMAs!
Traders who are confident that TSLA’s multi-month downtrend still has legs can start scaling in at current levels and then add up as soon as TSLA breaks below March’s lows.
But if the 100 SMA holds as support for another day, or if you see TSLA breaking above the trend line that we’ve marked, then you also gotta be ready for a longer-term reversal!


Comments are closed.