
I’m on the lookout for potential breakouts on these chart patterns!
Check out these triangle formations on the 4-hour chart of EUR/GBP and hourly time frame of USD/CHF.

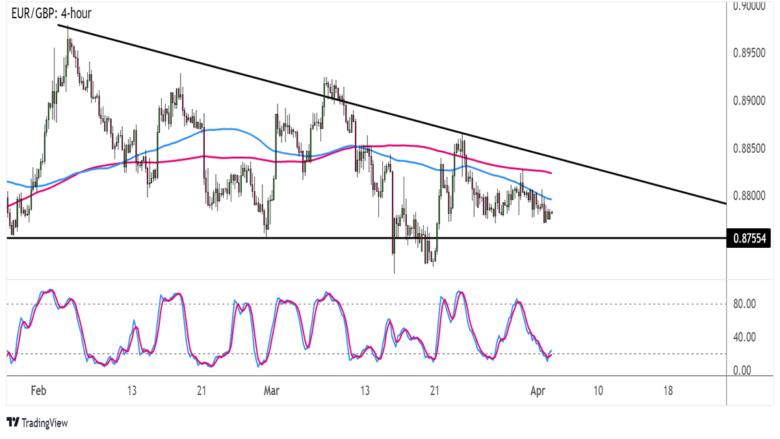
EUR/GBP 4-hour Forex Chart by TradingView
This pair has formed lower highs and found support around the .8755 mark, creating a descending triangle pattern since February.
A test of support seems to be in order, but technical indicators are giving mixed signals on whether a bounce or a break is due.
For one, Stochastic is already starting to pull higher from the oversold region to suggest a return in bullish vibes. In other words, buyers could step in to defend the floor and go for a move back to the triangle top.
On the other hand, the 100 SMA is still below the 200 SMA to suggest that the path of least resistance is to the downside. This suggests that the triangle bottom is more likely to break than to hold, spurring a selloff that’s the same height as the formation.
In any case, keep your eyes peeled for reversal or breakout candlesticks around the support zone to gauge where EUR/GBP is headed next!

USD/CHF 1-hour Forex Chart by TradingView
Here’s another triangle setup on the short-term chart of USD/CHF!
The pair is already down to the bottom of the formation, and it looks like a bounce back to the top might follow.
After all, Stochastic is already pulling up after a brief dip to the oversold area, hinting that bullish pressure is returning while sellers take a break. A bit of bullish divergence is even showing up, as the oscillator made higher lows while the pair had higher lows.
While the 100 SMA is below the 200 SMA, the gap between the indicators has narrowed to reflect slowing selling momentum.
In that case, USD/CHF could still climb to the triangle resistance, which happens to be near the dynamic inflection points at the moving averages.
Comments are closed.