XAG/USD retreats from key resistance, further downside hinges on $23.50 break
- Silver price takes a U-turn from a one-year-old descending resistance line, reverses from two-month high.
- Overbought RSI (14) suggest the XAG/USD’s further downside but bullish MACD signals, 12-day-old support line challenge bears.
- Silver buyers need validation from February’s high to retake control.
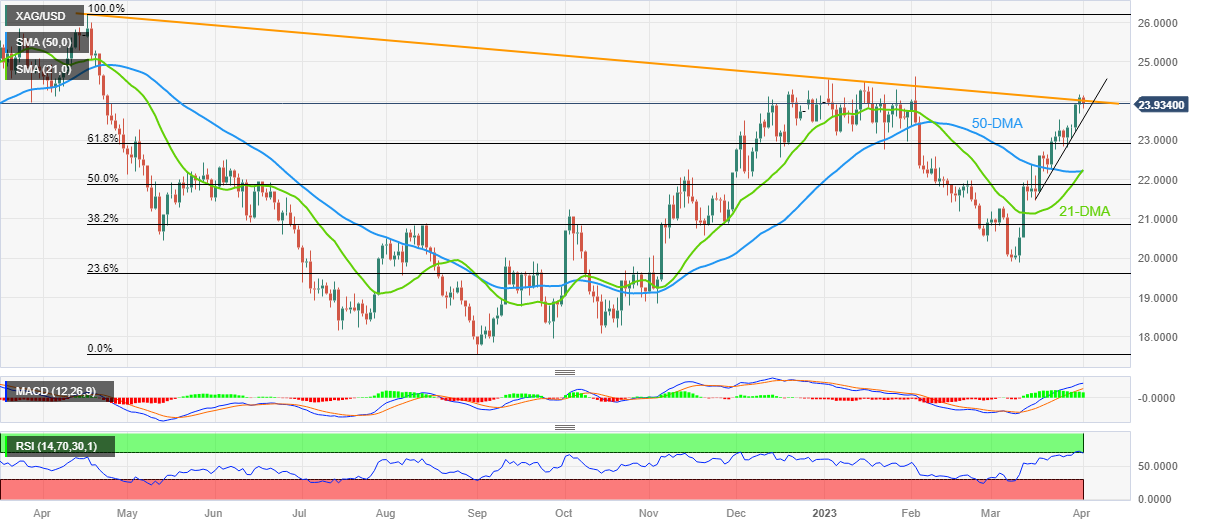
Silver price (XAG/USD) drops to $23.90 as it snaps a three-week uptrend during early Monday. In doing so, the bright metal reverses from a downward-sloping resistance line from April 2022. Adding strength to the XAG/USD pullback is the overbought RSI (14) line.
However, the bullish MACD signals and a two-week-old ascending support line, close to $23.50 by the press time, restrict the short-term downside of the Silver price.
Following that, the 61.8% Fibonacci retracement level of the metal’s April-September 2022 downturn, near $22.90, could lure the XAG/USD bears.
It’s worth noting, though, that a convergence of the 21-DMA and 50-DMA, around $22.20 by the press time, appears a tough nut to crack for the Silver bears.
In a case where the Silver price remains weak past $22.20, the 22.00 and 50% Fibonacci retracement level around $21.90 act as the last defenses of the XAG/USD buyers.
Meanwhile, an upside clearance of the one-year-long resistance line, close to $24.05 at the latest, isn’t an open invitation to the Silver buyers as February 2023 tops surrounding $24.65 challenges the XAG/USD bulls before directing them to the April 2022 high of near $26.25.
Should the Silver price remains firmer past $26.25, the previous yearly high surrounding $27.300 will be in focus.
Silver Price: Daily chart
Trend: Limited downside expected


Comments are closed.