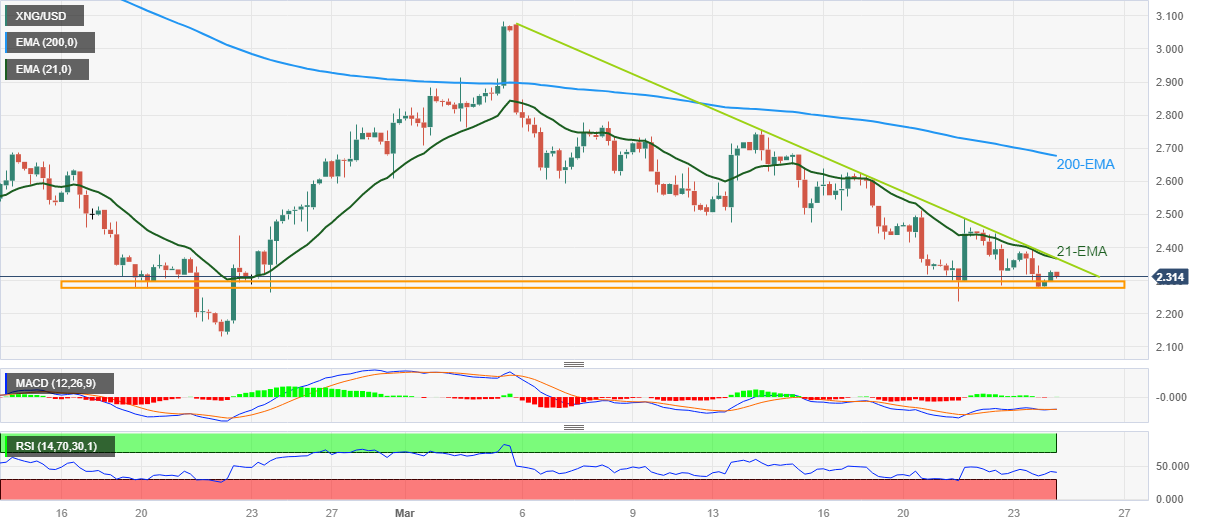
XNG/USD bounces off five-week-old support near $2.30
- Natural Gas snaps two-day downtrend but struggles to extend corrective bounce.
- Convergence of 21-EMA, three-week-old descending resistance line prods buyers.
- Multiple supports from late February restrict immediate downside.
- Sluggish oscillators suggest a continuation of downward grind.
Natural Gas Price (XNG/USD) portrays a corrective bounce from the short-term key support while snapping a two-day losing streak around $2.31 heading into Friday’s European session. In doing so, the energy benchmark bounces off a five-wee-long horizontal support area. Even so, XNG/USD remains pressured for the third consecutive week.
It’s worth observing that Natural Gas’s latest rebound lacks support from the MACD and RSI as both the oscillators portray a lack of momentum, which in turn increases the odds of the commodity’s further weakness.
However, a clear downside break of the $2.30-28 support area, encompassing multiple levels marked since February 19, restricts the short-term downside of the Natural Gas price.
Should the quote breaks the $2.28 support, the odds of witnessing a slump toward the monthly low of $2.13, also the lowest level since August 2020, can’t be ruled out.
In a case where the XNG/USD remains bearish past $2.13, the $2.00 will be crucial to watch as a break which could make the quite vulnerable to testing the mid-2020 lows surrounding $1.53.
On the flip side, a convergence of the 21-bar Exponential Moving Average (EMA) joins a downward-sloping trend line from March 05, to highlight $2.37 as the short-term key upside hurdle.
Also acting as important resistance for the Natural Gas price is $2.50 and the 200-EMA level surrounding $2.68.
Overall, Natural Gas price remains bearish but short-term grinding can’t be ruled out.
Natural Gas: Four-hour chart
Trend: Further downside expected


Comments are closed.