2D Transformation with built in eigenvector library , and coffee – Statistics – 20 December 2023
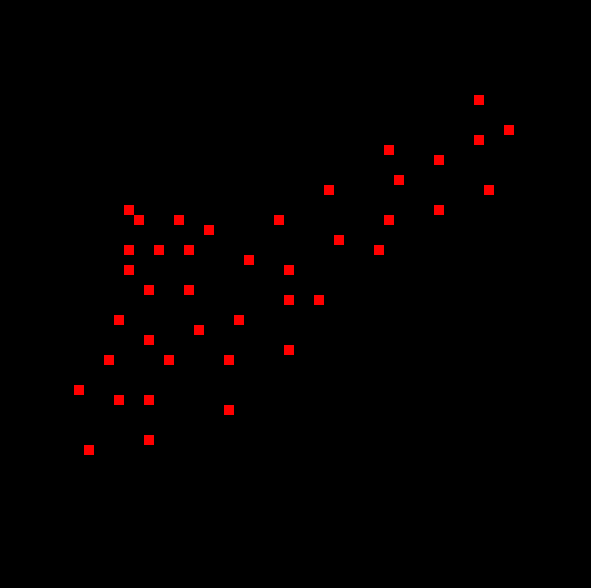
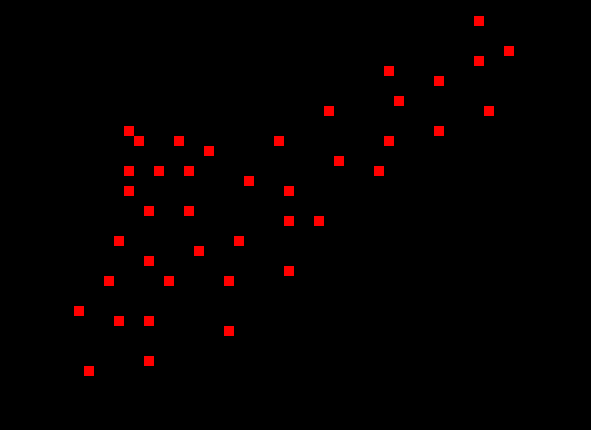
Lets open up ms paint and draw a cluster .

This is an upscale image of a 60×60 manually drawn bmp file
This file will be fed into our code and the code will have to transform it so that the
direction with the biggest variance sits on the x axis (if i understood things right).
So , some preliminary stuff , open the file , resource it , read the pixels , turn them to samples.
Our samples will look like this , we have one class , no fancy stuff.
      class a_sample{
            public:
            int x,y,cluster;
            double xd,yd;
            a_sample(void){x=0;y=0;cluster=0;}
            };
Ignore the cluster reading it was meant for another test -which failed-
These are the inputs we'll be working with :
#include <Canvas\Canvas.mqh>;
input string testBMP="test_2.bmp";
input color fillColor=C'255,0,0';
input color BaseColor=clrWheat;
input bool RemoveCovariance=false;
We read the image and turn each pixel that is red (or that matches our color input) to a sample.
  if(ResourceCreate("TESTRESOURCE","\\Files\\"+testBMP)){
  uint pixels[],width,height;
  if(ResourceReadImage("::TESTRESOURCE",pixels,width,height)){

      int total_samples=0;
      uint capture=ColorToARGB(fillColor,255);
      ArrayResize(samples,width*height,0);

        originalX=(int)width;
        originalY=(int)height;
        int co=-1;
        for(int y=0;y<(int)height;y++){
           for(int x=0;x<(int)width;x++){
              co++;
              if(pixels[co]==capture){
                total_samples++;
                samples[total_samples-1].x=x;
                samples[total_samples-1].y=y;
                samples[total_samples-1].xd=x;
                samples[total_samples-1].yd=y;
                }
              }
           }
      ArrayResize(samples,total_samples,0);
      Print("Found "+IntegerToString(total_samples)+" samples");
}
}
Neat , now we pass the samples into a matrix that is scaled with each sample being a row and each feature (x,y) being a column
           matrix original;
                  original.Init(total_samples,2);

                  for(int i=0;i<total_samples;i++){
                  original[i][0]=samples[i].xd;
                  original[i][1]=samples[i].yd;
                  }
So we shape (resize) the matrix to have total samples # of rows and 2 columns (x , y) . X+Y are our sample features in this example.
We then construct , well not we but the mq library costructs the covariance matrix , we pass false in the parameter as our features sit on the columns . Where our features on the rows , i.e. one row was one feature then we'd call this function using true.
matrix covariance_matrix=original.Cov(false);
What is the covariance matrix ? it is a features by features (features x features) (2×2) matrix that measures the covariance of each feature to all other features . Neat that we can use one line of code .
Then we need the eigenvectors and eigenvalues of that 2×2 covariance matrix
The theory i don't quite understands states that this will indicate the “direction” of most “variance”.
Let's play along
           matrix eigenvectors;
           vector eigenvalues;
           if(covariance_matrix.Eig(eigenvectors,eigenvalues)){
           Print("Eigenvectors");
           Print(eigenvectors);
           Print("Eigenvalues");
           Print(eigenvalues);
           }else{Print("Can't Eigen");}
the eigenvectors will be a 2×2 matrix as well if i'm not mistaken , same as the covariance martix.
Now , let's take our samples and “turn” them so that the most varying direction sits on the x axis.If that's how it works and it was not random.
Visualize what we are expecting to see here based on the first image posted.
This is how , so far :
           for(int i=0;i<total_samples;i++){
              vector thissample={samples[i].xd,samples[i].yd};
              thissample=thissample.MatMul(eigenvectors);
              samples[i].xd=thissample[0];
              samples[i].yd=thissample[1];
              }
I'm constructing a vector that is one sample , so 2 elements then matrix multiply it with the eigenvectors matrix then pass the resulting x and y back to the samples .
Then some transformation again , the reason is there is to accommodate multiple eigenvector passes , you probably will get the same idea.
             double minX=INT_MAX,maxX=INT_MIN,minY=INT_MAX,maxY=INT_MIN;
             for(int i=0;i<total_samples;i++){
                if(samples[i].xd>maxX){maxX=samples[i].xd;}
                if(samples[i].xd<minX){minX=samples[i].xd;}
                if(samples[i].yd>maxY){maxY=samples[i].yd;}
                if(samples[i].yd<minY){minY=samples[i].yd;}
                }

               double rangeX=maxX-minX;
               double rangeY=maxY-minY;
               double allMax=MathMax(maxX,maxY);
               double allMin=MathMin(minX,minY);
               double allRange=allMax-allMin;
               for(int i=0;i<total_samples;i++){
                  samples[i].xd=((samples[i].xd-minX)/rangeX)*1000.0;
                  samples[i].yd=((samples[i].yd-minY)/rangeY)*1000.0;
                  samples[i].x=(int)samples[i].xd;
                  samples[i].y=(int)samples[i].yd;
                  }
               originalX=1000;
               originalY=1000;
Then the drawing part which is not that important .
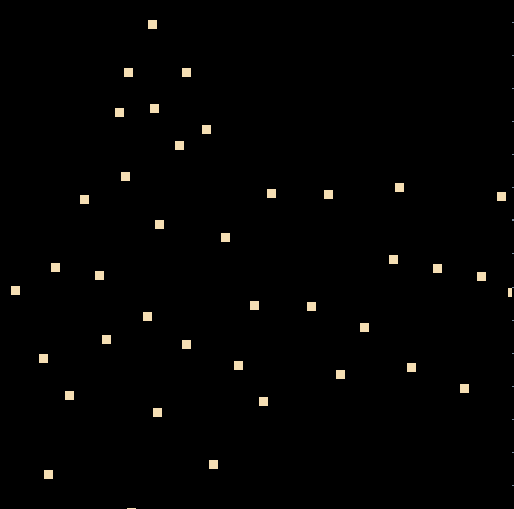
this is the outcome

The samples touching the edges is more due to our reconstruction but the transformation occured.
Here is the full code , i've left my mistakes in commented out , and also the removeCovariance is not working.
If you find issues let me know.
Now imagine you have 1000 features right ? you cannot plot all that so how do we construct a new feature that is a synthetic weighted sum of the old features based on the eigenvectors (if i'm on the right track here) . Like Principle component analysis .
#property version   "1.00"
#include <Canvas\Canvas.mqh>;
input string testBMP="test_2.bmp";
input color fillColor=C'255,0,0';
input color BaseColor=clrWheat;
input bool RemoveCovariance=false;
string system_tag="TEST_";
      class a_sample{
            public:
            int x,y,cluster;
            double xd,yd;
            a_sample(void){x=0;y=0;cluster=0;}
            };
int DISPLAY_X,DISPLAY_Y,originalX,originalY;
double PIXEL_RATIO_X=1.0,PIXEL_RATIO_Y=1.0;
bool READY=false;
a_sample samples[];
CCanvas DISPLAY;
int OnInit()
  {
  ArrayFree(samples);
  DISPLAY_X=0;
  DISPLAY_Y=0;
  originalX=0;
  originalY=0;
  PIXEL_RATIO_X=1.0;
  PIXEL_RATIO_Y=1.0;
  READY=false;
  ObjectsDeleteAll(ChartID(),system_tag);
  EventSetMillisecondTimer(44);
  ResourceFree("TESTRESOURCE");
  return(INIT_SUCCEEDED);
  }

void OnTimer(){
EventKillTimer();

  if(ResourceCreate("TESTRESOURCE","\\Files\\"+testBMP)){
  uint pixels[],width,height;
  if(ResourceReadImage("::TESTRESOURCE",pixels,width,height)){

      int total_samples=0;
      uint capture=ColorToARGB(fillColor,255);
      ArrayResize(samples,width*height,0);

        originalX=(int)width;
        originalY=(int)height;
        int co=-1;
        for(int y=0;y<(int)height;y++){
           for(int x=0;x<(int)width;x++){
              co++;
              if(pixels[co]==capture){
                total_samples++;
                samples[total_samples-1].x=x;
                samples[total_samples-1].y=y;
                samples[total_samples-1].xd=x;
                samples[total_samples-1].yd=y;
                }
              }
           }
      ArrayResize(samples,total_samples,0);
      Print("Found "+IntegerToString(total_samples)+" samples");


           matrix original;
                  original.Init(total_samples,2);

                  for(int i=0;i<total_samples;i++){
                  original[i][0]=samples[i].xd;
                  original[i][1]=samples[i].yd;
                  }


           matrix covariance_matrix=original.Cov(false);
           Print("Covariance matrix");
           Print(covariance_matrix);
           matrix eigenvectors;
           vector eigenvalues;
           matrix inverse_covariance_matrix=covariance_matrix.Inv();
           if(covariance_matrix.Eig(eigenvectors,eigenvalues)){
           Print("Eigenvectors");
           Print(eigenvectors);
           Print("Eigenvalues");
           Print(eigenvalues);

           for(int i=0;i<total_samples;i++){
              vector thissample={samples[i].xd,samples[i].yd};
              thissample=thissample.MatMul(eigenvectors);
              samples[i].xd=thissample[0];
              samples[i].yd=thissample[1];
              if(RemoveCovariance){
                samples[i].xd/=MathSqrt(eigenvalues[0]);
                samples[i].yd/=MathSqrt(eigenvalues[1]);
                }

              }


             double minX=INT_MAX,maxX=INT_MIN,minY=INT_MAX,maxY=INT_MIN;
             for(int i=0;i<total_samples;i++){
                if(samples[i].xd>maxX){maxX=samples[i].xd;}
                if(samples[i].xd<minX){minX=samples[i].xd;}
                if(samples[i].yd>maxY){maxY=samples[i].yd;}
                if(samples[i].yd<minY){minY=samples[i].yd;}
                }

               double rangeX=maxX-minX;
               double rangeY=maxY-minY;
               double allMax=MathMax(maxX,maxY);
               double allMin=MathMin(minX,minY);
               double allRange=allMax-allMin;
               for(int i=0;i<total_samples;i++){
                  samples[i].xd=((samples[i].xd-minX)/rangeX)*1000.0;
                  samples[i].yd=((samples[i].yd-minY)/rangeY)*1000.0;

                  samples[i].x=(int)samples[i].xd;
                  samples[i].y=(int)samples[i].yd;
                  }
               originalX=1000;
               originalY=1000;
           }else{Print("Cannot eigen");}

      build_deck(originalX,originalY);
      READY=true;
    }else{
    Print("Cannot read image");
    }
  }else{
  Print("Cannot load file");
  }
ExpertRemove();
Print("DONE");
}

void build_deck(int img_x,
                int img_y){

  int screen_x=(int)ChartGetInteger(ChartID(),CHART_WIDTH_IN_PIXELS,0);
  int screen_y=(int)ChartGetInteger(ChartID(),CHART_HEIGHT_IN_PIXELS,0);

  int btn_height=40;
  screen_y-=btn_height;

  double img_x_by_y=((double)img_x)/((double)img_y);

    int test_x=screen_x;
    int test_y=(int)(((double)test_x)/img_x_by_y);
    if(test_y>screen_y){
    test_y=screen_y;
    test_x=(int)(((double)test_y)*img_x_by_y);
    }

  int px=(screen_x-test_x)/2;
  int py=(screen_y-test_y)/2;
DISPLAY.CreateBitmapLabel(ChartID(),0,system_tag+"_display",px,py,test_x,test_y,COLOR_FORMAT_ARGB_NORMALIZE);
DISPLAY_X=test_x;
DISPLAY_Y=test_y;
DISPLAY.Erase(0);
PIXEL_RATIO_X=((double)(DISPLAY_X))/((double)(img_x));
PIXEL_RATIO_Y=((double)(DISPLAY_Y))/((double)(img_y));
PIXEL_RATIO_X=MathMax(1.0,PIXEL_RATIO_X);
PIXEL_RATIO_Y=MathMax(1.0,PIXEL_RATIO_Y);

PIXEL_RATIO_X=8.0;
PIXEL_RATIO_Y=8.0;
update_deck();
}


void update_deck(){
DISPLAY.Erase(ColorToARGB(clrBlack,255));
uint BASECOLOR=ColorToARGB(BaseColor,255);


  for(int i=0;i<ArraySize(samples);i++){
  double newx=(((double)samples[i].x)/((double)originalX))*((double)DISPLAY_X);
  double newy=(((double)samples[i].y)/((double)originalY))*((double)DISPLAY_Y);
  int x1=(int)MathFloor(newx-PIXEL_RATIO_X/2.00);
  int x2=(int)MathFloor(newx+PIXEL_RATIO_X/2.00);
  int y1=(int)MathFloor(newy-PIXEL_RATIO_Y/2.00);
  int y2=(int)MathFloor(newy+PIXEL_RATIO_Y/2.00);
  DISPLAY.FillRectangle(x1,y1,x2,y2,BASECOLOR);
  }
DISPLAY.Update(true);
ChartRedraw();
}


void OnDeinit(const int reason)
  {
  }
void OnTick()
  {
  }
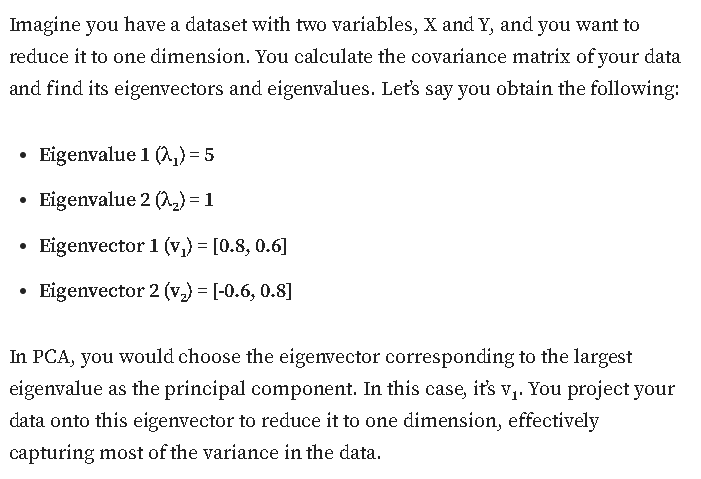
Edit : Found an article on how to do the feature composition :
Although i think , not sure , but i think you don't reduce from 2 features to 1 feature . The wording is wrong.
You create one feature from 2 features and you are left with one new feature.
So if we had 100 features and we did the following we'd not get 99 features but one feature , one new feature.
I think.

https://techntales.medium.com/eigenvalues-and-eigenvectors-and-their-use-in-machine-learning-and-ai-c7a5431ae388#:~:text=Eigenvalues%20and%20eigenvectors%20are%20concepts,machine%20learning%20and%20artificial%20intelligence.


Comments are closed.