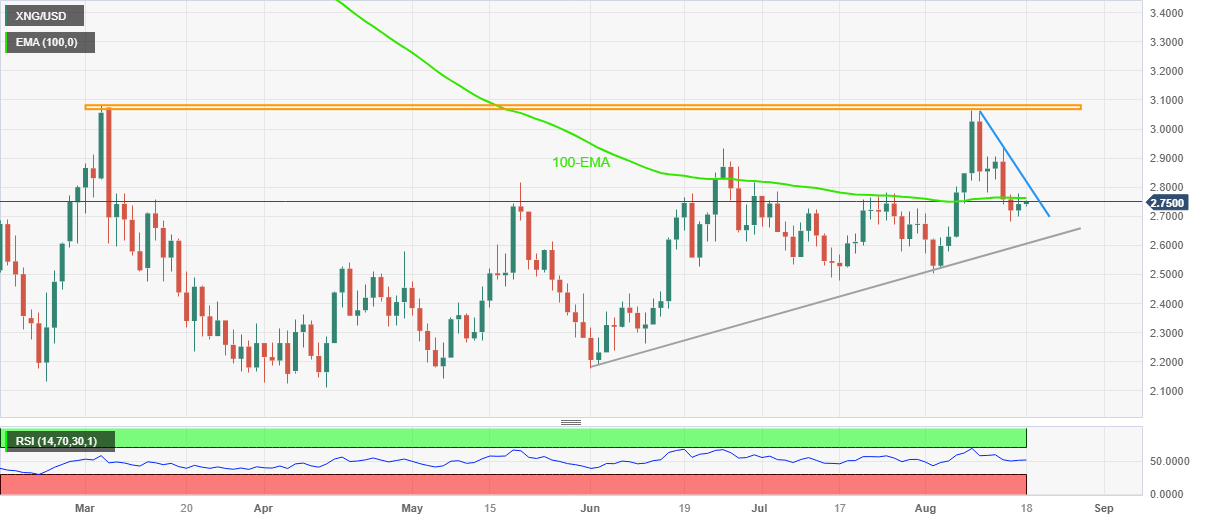
100-EMA prods XNG/USD rebound near $2.75
- Natural Gas Price struggles to defend corrective bounce off the lowest level in a fortnight.
- Steady RSI suggests further recovery but one-week-old resistance line adds to the upside filters.
- Rising trend line from June appears key support for XNG/USD bears to watch.
Natural Gas Price (XNG/USD) clings to mild gains around $2.75 amid early Friday morning in Europe. In doing so, the energy instrument justifies the market’s indecision amid a light calendar and mixed fundamentals about the energy market, as well as a pullback in the US Dollar and the Treasury bond yields.
With this, the XNG/USD pares the weekly losses while poking the 100-day Exponential Moving Average (EMA) level of around $2.76. Not only the market’s consolidation due to the pullback in the US Treasury bond yields but a steady RSI (14) line also favor the intraday buyers of the Natural Gas Price.
Amid this plays, the XNG/USD is likely to extend the latest rebound towards crossing the 100-EMA hurdle surrounding $2.76. However, a downward-sloping resistance line from August 10, around $2.82 by the press time, restricts the further advances of the Natural Gas Price.
In a case where the XNG/USD remains firmer past $2,.82, the odds of witnessing another attept to cross the 5.5-month-old horizontal resistance surrounding $3.06-08 can’t be ruled out.
Meanwhile, a pullback in the Natural Gas Price will challenge an ascending support line from June 01, around $2.60.
However, a daily closing below $2.60 will make the XNG/USD vulnerable to declining toward July’s low of $2.48.
Overall, Natural Gas price pare weekly losses but the buyers have a long way to ride before retaking control.
Natural Gas Price: Daily chart
Trend: Limited recovery expected


Comments are closed.