1.3900 Holds Firm as DXY Retreats, Will 20-Day MA Provide Support?
USD/CAD PRICE, CHARTS AND ANALYSIS:
Read More: The Bank of Canada: A Trader’s Guide
USDCAD has continued to selloff today following a rejection at the 1.3900 resistance level. The decline in the DXY has helped USDCAD push lower as well in what will be a welcomed by the Bank of Canada and Canadian consumers. In October the Canadian Dollar was the third worst performing G10 currency as it lost ground against the Greenback, the rise in Oil prices not even able to support the CAD.
Recommended by Zain Vawda
Get Your Free Top Trading Opportunities Forecast
USD INDEX AND US, CANADIAN DATA AHEAD
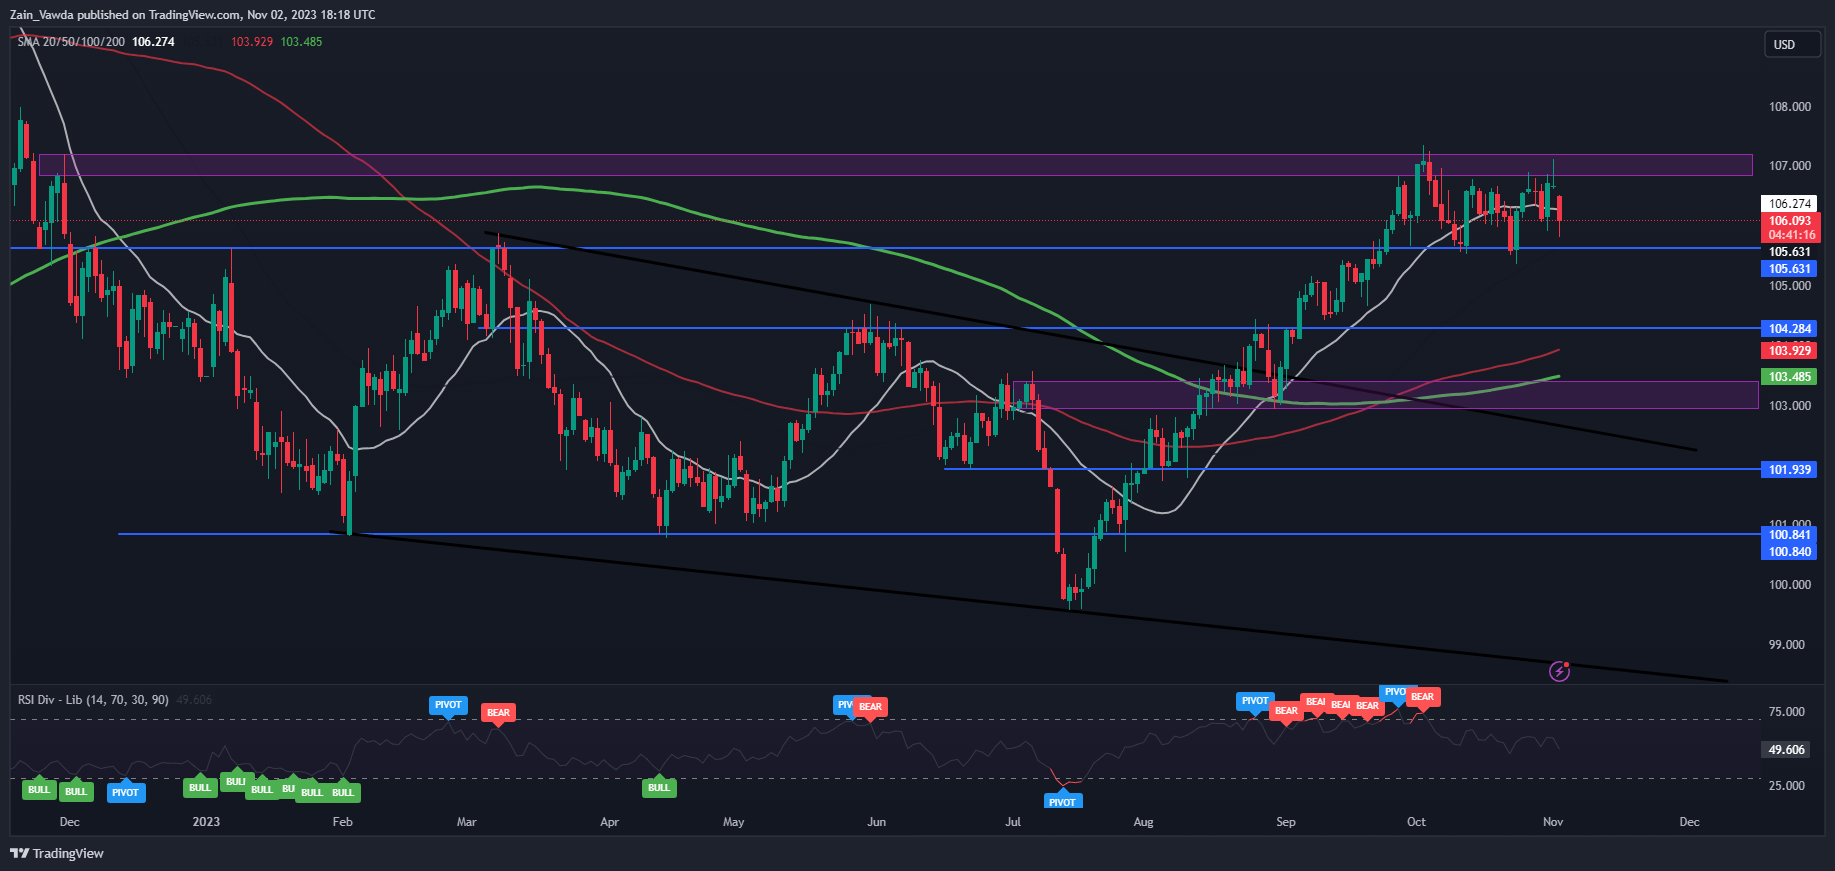
The Dollar Index continues to struggle at the key resistance area around the 1.0680-1.0720 area. The failure to break higher yesterday was bolstered by the FOMC meeting which saw the FED maintain their current policy path and outlook despite robust US data. The result saw market participants pin their hopes on the idea that the Fed is now done with hiking and the next move likely to be a rate cut, with participants now seeing a 70% chance of a rate cut in June of 2024.
DXY Daily Chart
Source: TradingView
Data tomorrow could be key for USDCAD as we have releases from both the US and Canada. Canadian Unemployment and average hourly wage data will be released but is likely to be overshadowed by the release of the US NFP and labor data release. The NFP is even more interesting this month following a blockbuster print last month, with market participants keeping a close watch to gauge whether that was a one off or whether the strong hiring of late will continue.

For all market-moving economic releases and events, see the DailyFX Calendar
TECHNICAL ANALYSIS USDCAD
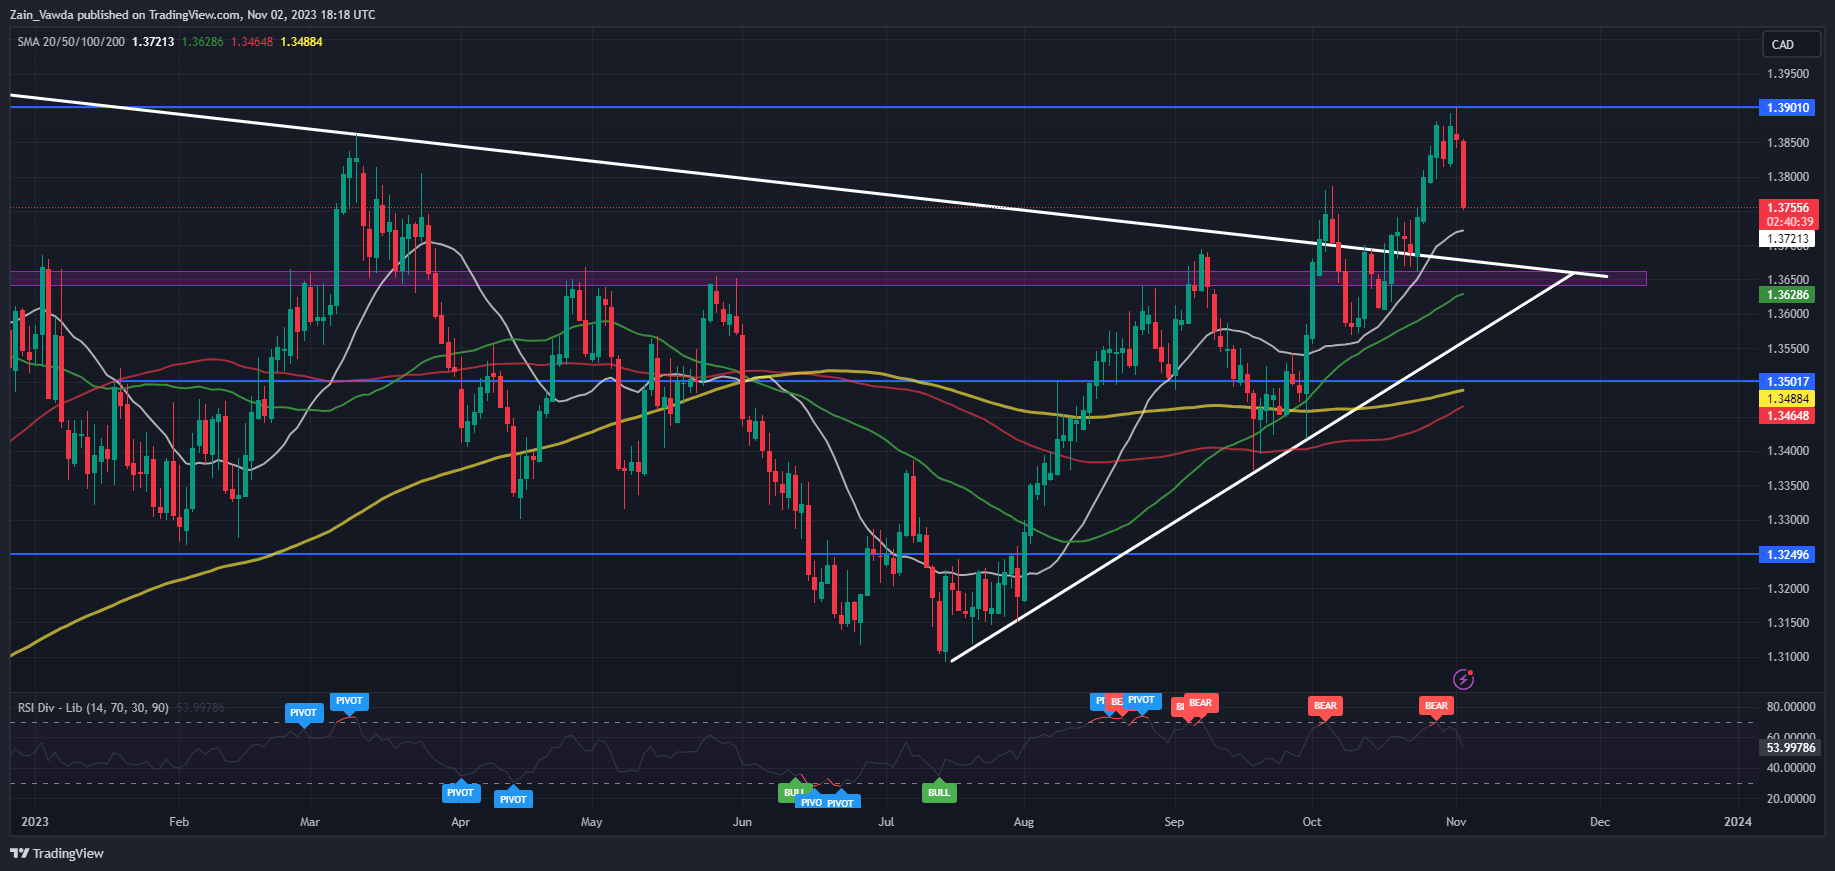
USDCAD failed in its attempts to pierce through the 1.3900 resistance area closing yesterday with a shooting star candle close and followed by another bearish day. A candle close as we stand now would see the pair print an evening star candlestick pattern which is strong reversal pattern and could signal further downside ahead.
Immediate support is provided by the 20-day MA around 1.3720 which hovers just above the recent descending trendline break and support around the 1.3650 mark. Alternatively, if we are to rally higher tomorrow post the NFP release and break above the recent high at 1.3900 then focus will shift to the psychological 1.4000 handle as a key area of resistance.
Key Levels to Keep an Eye On:
Support levels:
Resistance levels:
USD/CAD Daily Chart
Source: TradingView, prepared by Zain Vawda
IG CLIENT SENTIMENT
Taking a look at the IG client sentiment data and we can see that retail traders are currently net SHORT with 68% of Traders holding short positions. Given the contrarian view adopted here at DailyFX to Client Sentiment will USDCAD revisit recent highs at 1.3900?
For Tips and Tricks on How to use Client Sentiment Data, Get Your Free Guide Below
| Change in | Longs | Shorts | OI |
| Daily | 19% | -25% | -16% |
| Weekly | 7% | -23% | -15% |
— Written by Zain Vawda for DailyFX.com
Contact and follow Zain on Twitter: @zvawda


Comments are closed.