

Number of traders net-short has increased by 23.80% from last week.
| SYMBOL | TRADING BIAS | NET-LONG% | NET-SHORT% | CHANGE IN LONGS | CHANGE IN SHORTS | CHANGE IN OI |
|---|---|---|---|---|---|---|
| GBP/USD | BULLISH | 47.59% | 52.41% |
-31.73% Daily -29.60% Weekly |
18.79% Daily 23.80% Weekly |
-12.15% Daily -9.03% Weekly |
| Change in | Longs | Shorts | OI |
| Daily | -31% | 10% | -15% |
| Weekly | -31% | 21% | -11% |
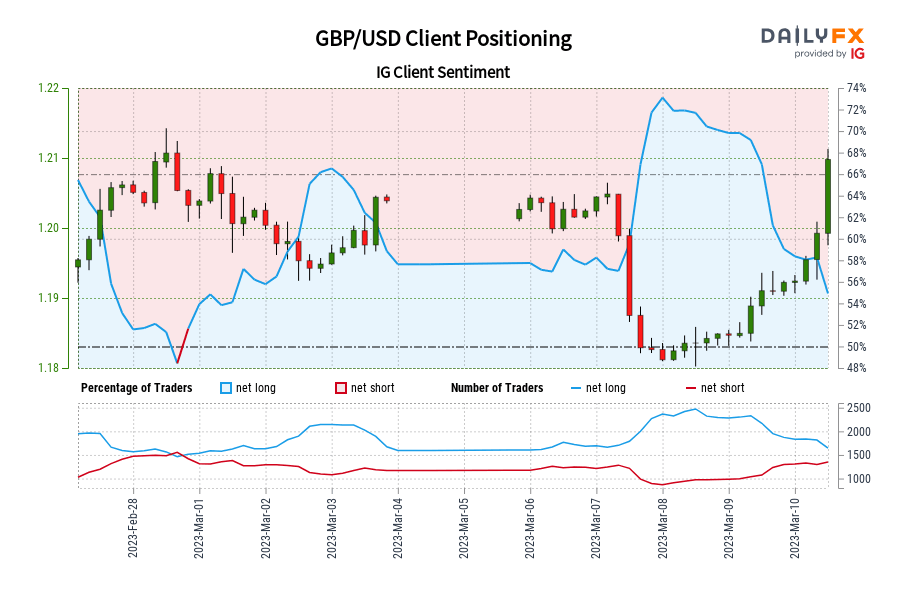
GBP/USD: Retail trader data shows 47.59% of traders are net-long with the ratio of traders short to long at 1.10 to 1. In fact, traders have remained net-short since Feb 28 when GBP/USD traded near 1.20, price has moved 0.26% higher since then. The number of traders net-long is 31.73% lower than yesterday and 29.60% lower from last week, while the number of traders net-short is 18.79% higher than yesterday and 23.80% higher from last week.
We typically take a contrarian view to crowd sentiment, and the fact traders are net-short suggests GBP/USD prices may continue to rise.
Our data shows traders are now net-short GBP/USD for the first time since Feb 28, 2023 18:00 GMT when GBP/USD traded near 1.20. Traders are further net-short than yesterday and last week, and the combination of current sentiment and recent changes gives us a stronger GBP/USD-bullish contrarian trading bias.
Comments are closed.