
Gold (XAU/USD) Price Outlook:
- Gold futures retest $1,950 before easing back into narrow range.
- XAU/USD gaps on opening, diving the RSI deeper into overbought territory
- USD remains constricted in anticipation of the FOMC and NFP’s later this week.
Recommended by Tammy Da Costa
Download Your Fresh Q1 Forecast
Gold Futures Run into Technical Resistance – Opening Gap Supports Higher Prices
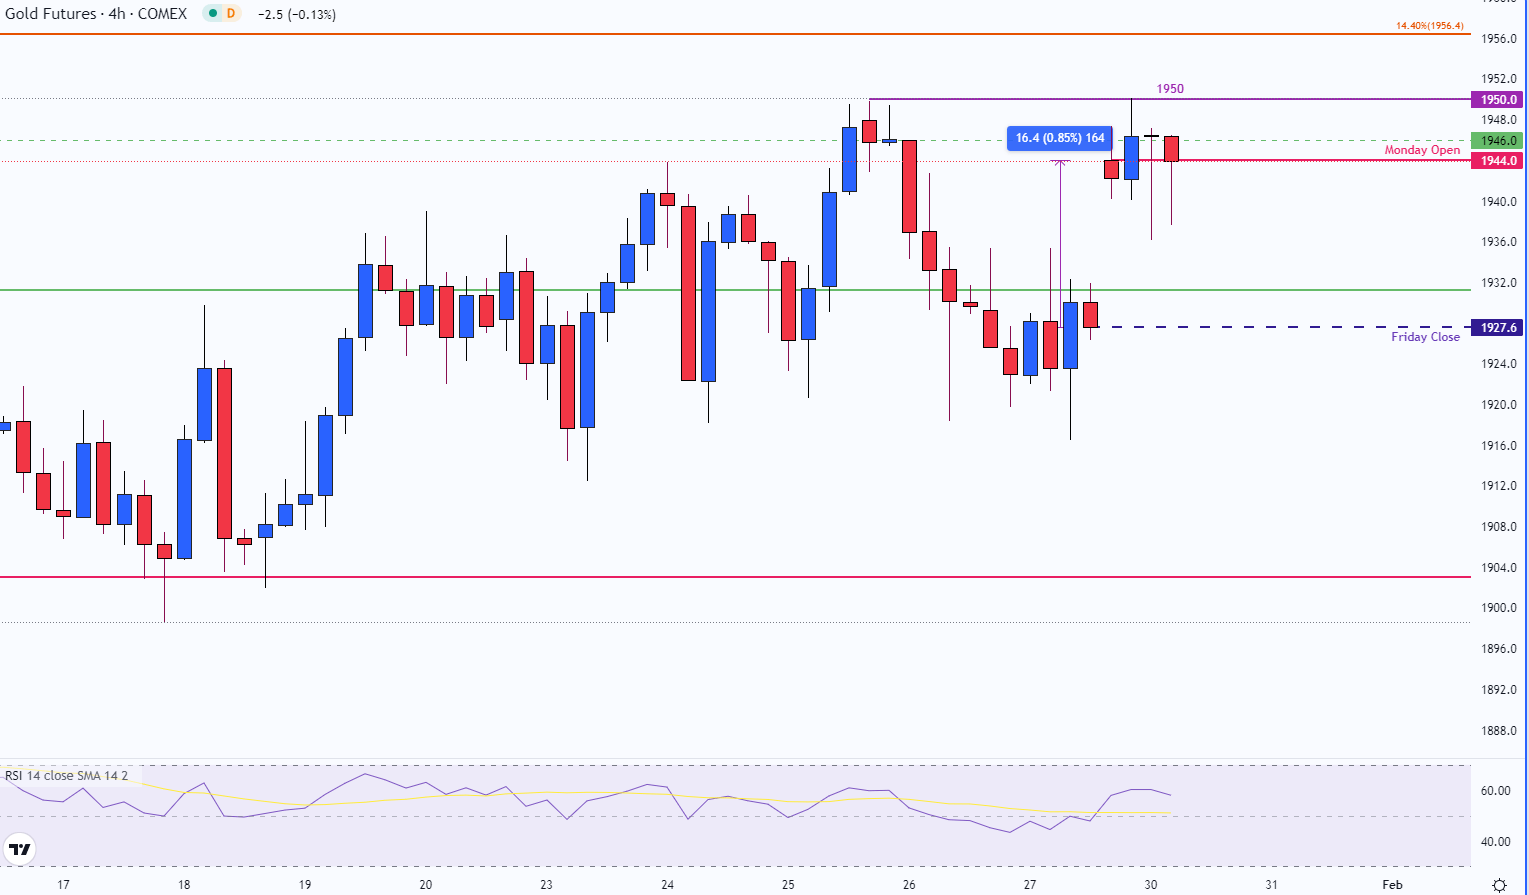
Gold prices are trading over 6% higher for the month of January, driving XAU/USD into a barrier of resistance at $1,950. Throughout last week, the same psychological level that limited the upside move came into play after gold opened the session at a level of $1,944.
This was 0.85% higher than Friday’s close of $1,927.6. While the discrepancy between the two prices resulted in an opening gap, prices pulled back slightly before peaking at $1,950.1.
Gold (GC1!) Four-hour Chart

Chart prepared by Tammy Da Costa using TradingView
However, while central banks prepare for another round of rate hikes, the daily chart reflects highlights the gap that currently remains intact.
Visit the DailyFX Educational Center to discover how monetary policy affects Forex trading
Gold (GC1!) Daily Chart
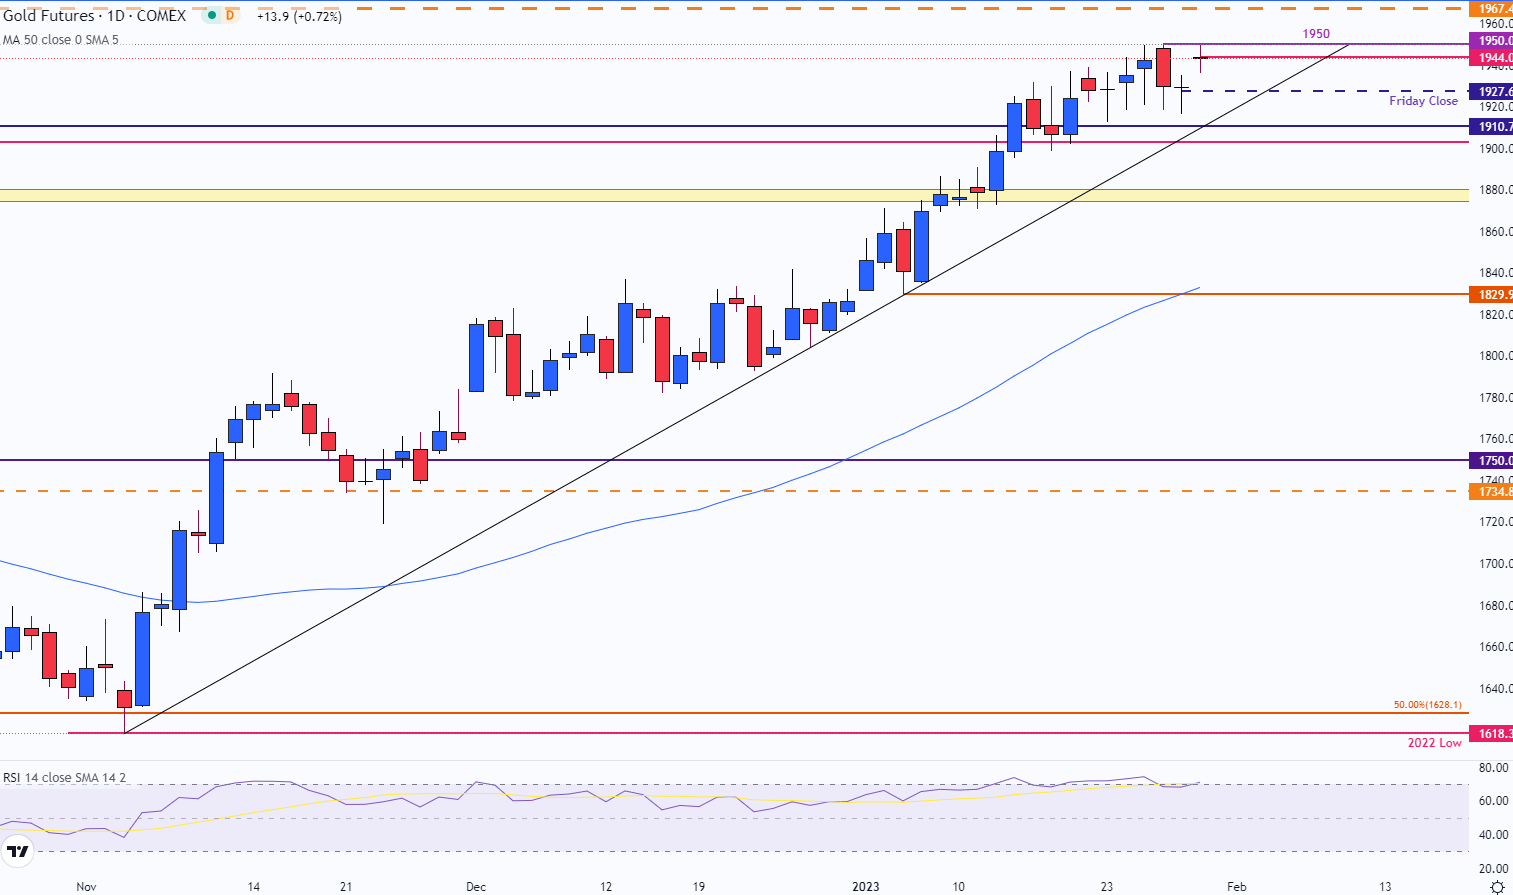
Chart prepared by Tammy Da Costa using TradingView
Recommended by Tammy Da Costa
Futures for Beginners
Gold (XAU/USD) Technical Analysis
After three consecutive months of gains, a return to April 2022 levels has pushed the weekly and daily RSI (relative strength index) into overbought territory.
Since reaching a low of $1,618 in October last year, the 20% rally has been supported by lower rate expectations and rising recession risks. Although the shift in rhetoric and hopes of a slowdown in the pace of tightening (QT) has helped facilitate the rebound, technical headwinds remain firm.
Gold (GC1!) Weekly Chart
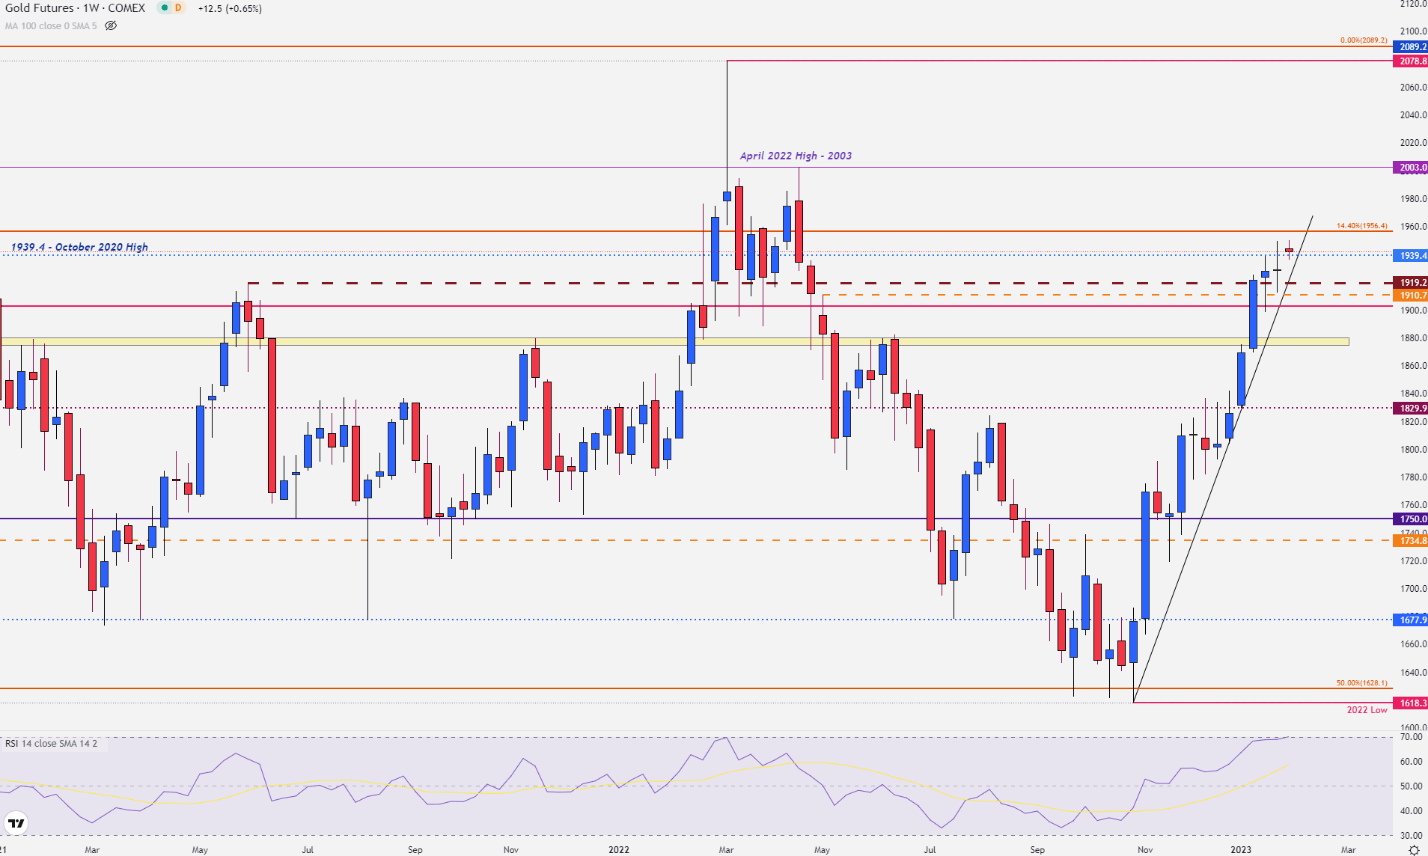
Chart prepared by Tammy Da Costa using TradingView
With gold futures currently trading around the October high of $1,939.4, price action temporarily stalled, creating a doji candle on the weekly chart. As the RSI continues to threaten the upper bound of the ‘normal range’, the technical indicator suggests that bullish momentum may be reaching an extreme.
While central banks prepare for another round of rate hikes, this week’s economic docket could provide an additional catalyst for price action.
Recommended by Tammy Da Costa
Trading Forex News: The Strategy
If the Fed, ECB or BoE hike rates announce a rate hike that is higher than forecasts, gold prices could ease. Similarly, if economic data suggests that a global recession may be unavoidable and growth forecasts fade, gold prices could benefit.
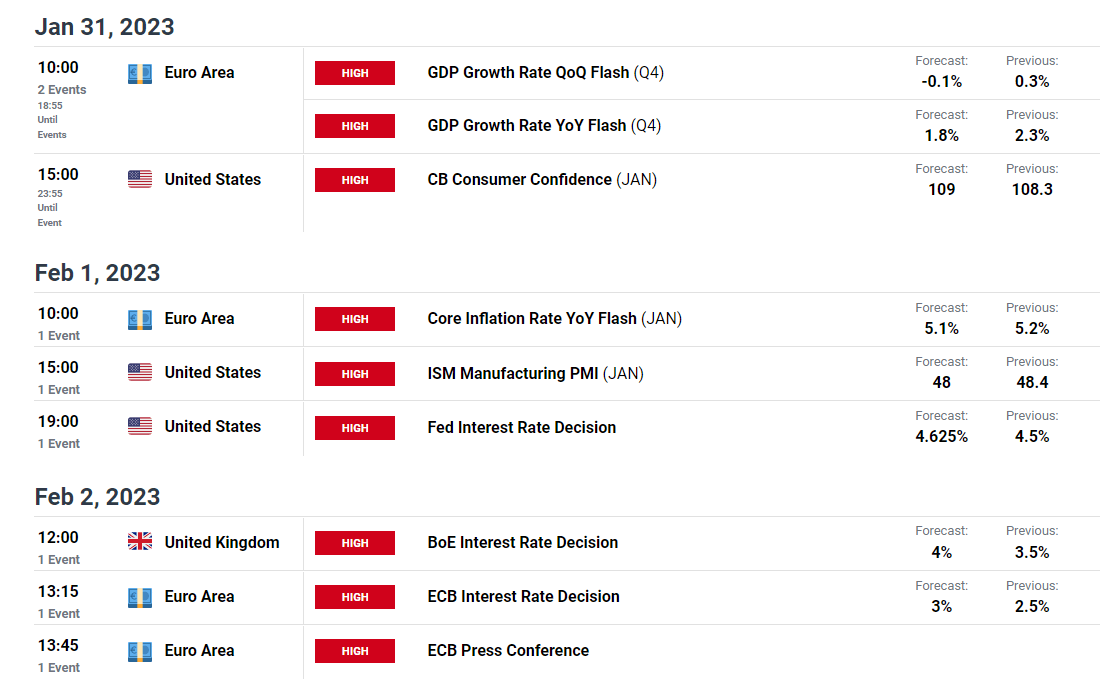
DailyFX Economic Calendar
If prices remain above $1,944, the $1,950 handle remains as resistance which could bring the next level of resistance into play at the November 2020 high of $1,961.8.
— Written by Tammy Da Costa, Analyst for DailyFX.com
Contact and follow Tammy on Twitter: @Tams707
Comments are closed.