

US Dollar Talking Points:
- The US Dollar printed a doji on the weekly bar, holding right around the 102 level that’s the 50% mark of the 2021-2022 major move.
- Fundamentals are driving the market next week as we get the FOMC on Wednesday followed by the Bank of England and the European Central Bank on Thursday, and NFP on Friday.
- The analysis contained in article relies on price action and chart formations. To learn more about price action or chart patterns, check out our DailyFX Education section.
Recommended by James Stanley
Get Your Free USD Forecast
The US Dollar was flat for this week’s trade, printing a doji on the weekly chart for the second consecutive week. This impasse likely won’t last for much longer, however, as next week’s economic calendar is absolutely loaded with high-impact events, such as the Fed on Wednesday or the BoE and ECB on Thursday. And if the major Central Banks aren’t enough, there’s an NFP report on Friday and given the stance taken by the Fed on Wednesday, that jobs report may be even more important than usual as the FOMC monitors data for signs of slowdown from the mass of rate hikes from last year.
At this point the technical position of the US Dollar still shows impact from the early-month breakdown extension. The USD had held support around 103.45 coming into the New Year and that had even led to some bounce in the first week of January. But that all came undone Friday of that week (Jan 6th), when an abysmal Services PMI report shocked markets and drove an extension to the USD sell-off.
The other side of that theme strength in stocks, which continued to show through last week. And there’s a logical relationship in there as the disappointing PMI report was read as something that may push the Fed into a less-hawkish position. But whether that comes to fruition remains to be seen and next week we’ll hear directly from the Fed on the matter. And then the day after, we’ll hear from the ECB and BoE, both of which are pertinent to the US Dollar as the Euro makes up 57.6% and the British Pound 11.9% of the DXY quote.
US Dollar
The US Dollar weekly chart has shown two consecutive dojis and before that showed up, there was another stand of support that had lasted for a few weeks into the end of the year. From longer-term charts, bulls have started to put up a fight at lows but they haven’t quite been able to take-control yet.
US Dollar Weekly Chart
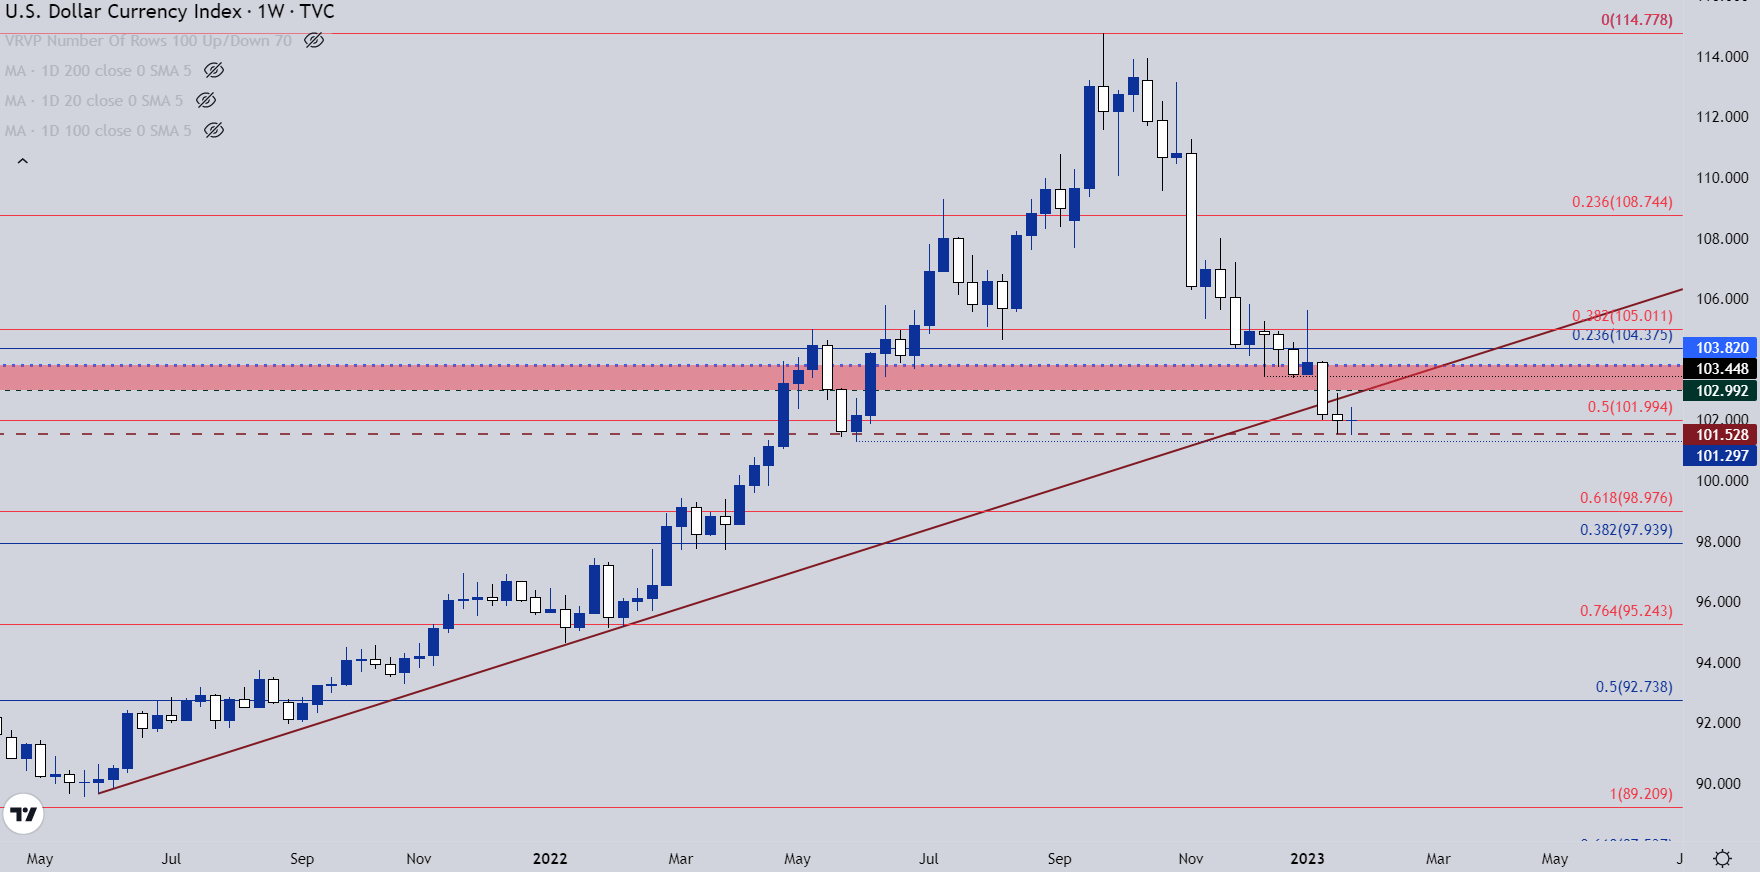
Chart prepared by James Stanley; USD, DXY on Tradingview
Next week is the type of week where something like that could happen. With the Fed on Wednesday the big hope from equity markets is that the bank is nearing a pause on rate hikes. And some economic data, such as the Services PMI report from a few weeks ago, speaks to that.
At this point the US Dollar remains right around the 102 level. This is the 50% mark of the 2021-2022 major move and it had also helped to build a doji formation in the prior week. Collectively, this highlights a slowing down-trend that’s started to get more and more sticky around key support levels, allowing for the build of a falling wedge formation.
The falling wedge combined with the slowing sell-off are factors that could lead-in to a reversal. But, at this point, we haven’t seen much from bulls and they’re going to need to show up next week to keep that hope alive for the DXY. Otherwise, we could be soon looking at EUR/USD re-testing the 1.1000 handle, which I’ll look at next.
US Dollar Daily Chart
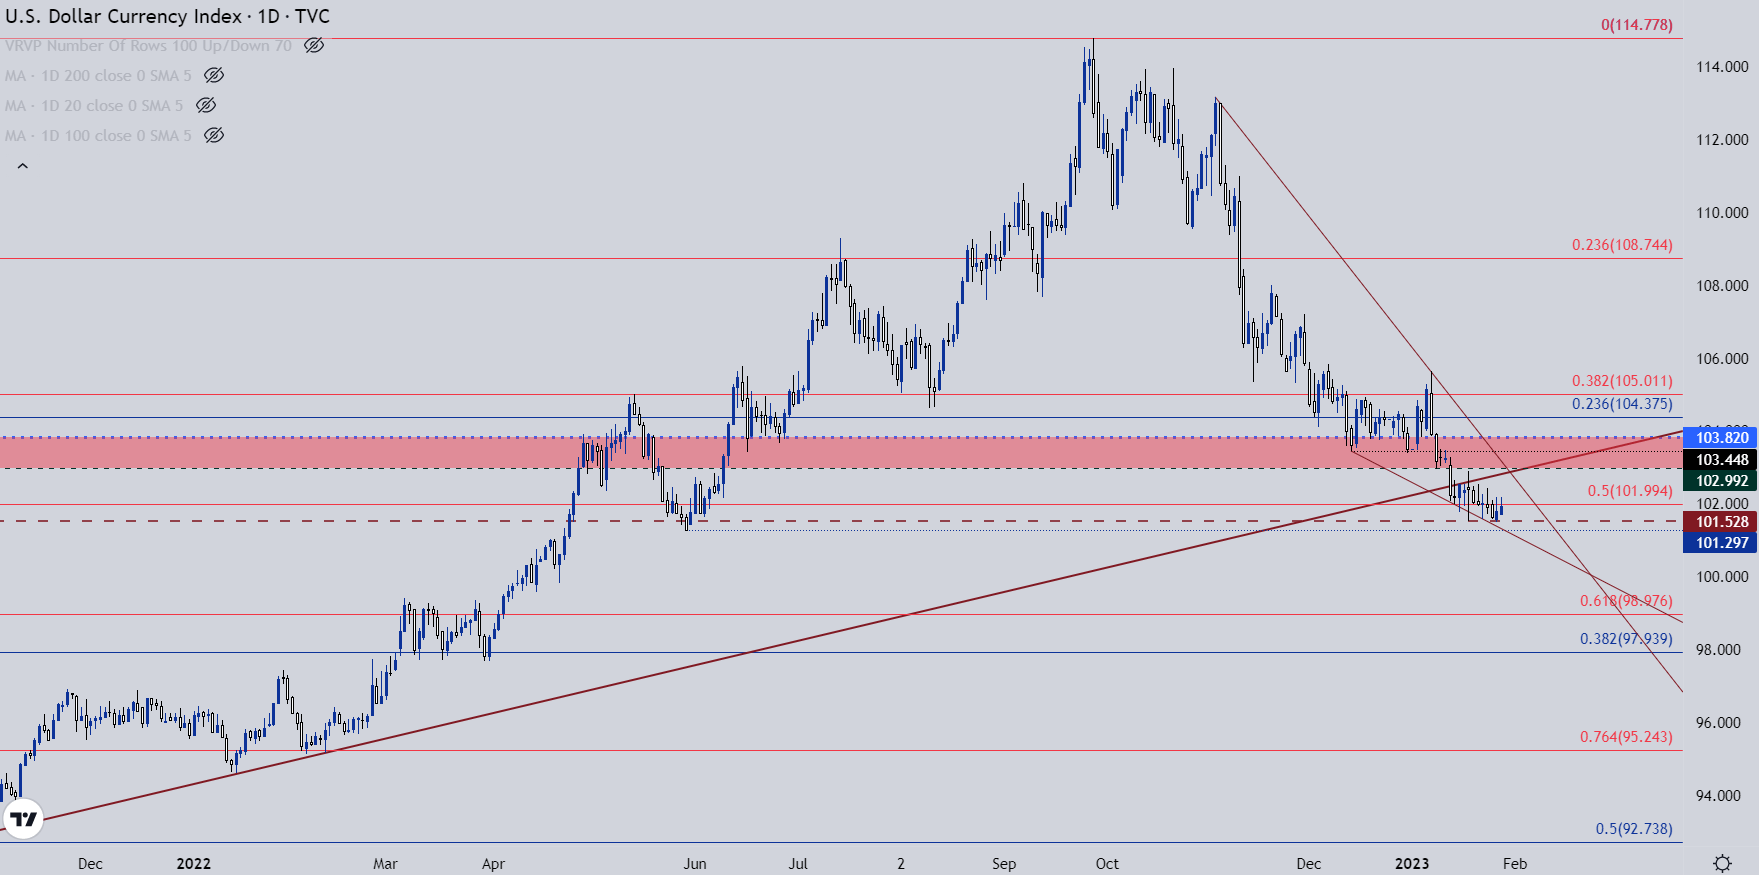
Chart prepared by James Stanley; USD, DXY on Tradingview
EUR/USD
The Euro has been well-bid of late on hope of more rate hikes out of Europe. Like the USD, reversal scenarios were starting to show up in the first week of the year, with an abrupt change around the release of Services PMI on January 6th. At that point, EUR/USD found support at a prior resistance trendline and then bounced up to another fresh high. That breakout ran for about a week but, since then, price has continued to show a pattern of digestion in the form of a rising wedge.
Resistance at this point has held just inside of the 1.0933 level which was a double top in April of last year. Sellers had an open door this week but seemingly couldn’t continue to walk through it, which opens the possibility of a capitulation high given the 1.1000 handle that’s just a little bit above current price. And if the wedge does start to give way before a failed breakout shows, it’s the 1.0711 level that remains key as this was a point of support-turned-resistance before the previous breakout.
There’s a big support zone from around 1.0746-1.0787 and that can be a very noisy area for bears.
EUR/USD Daily Chart
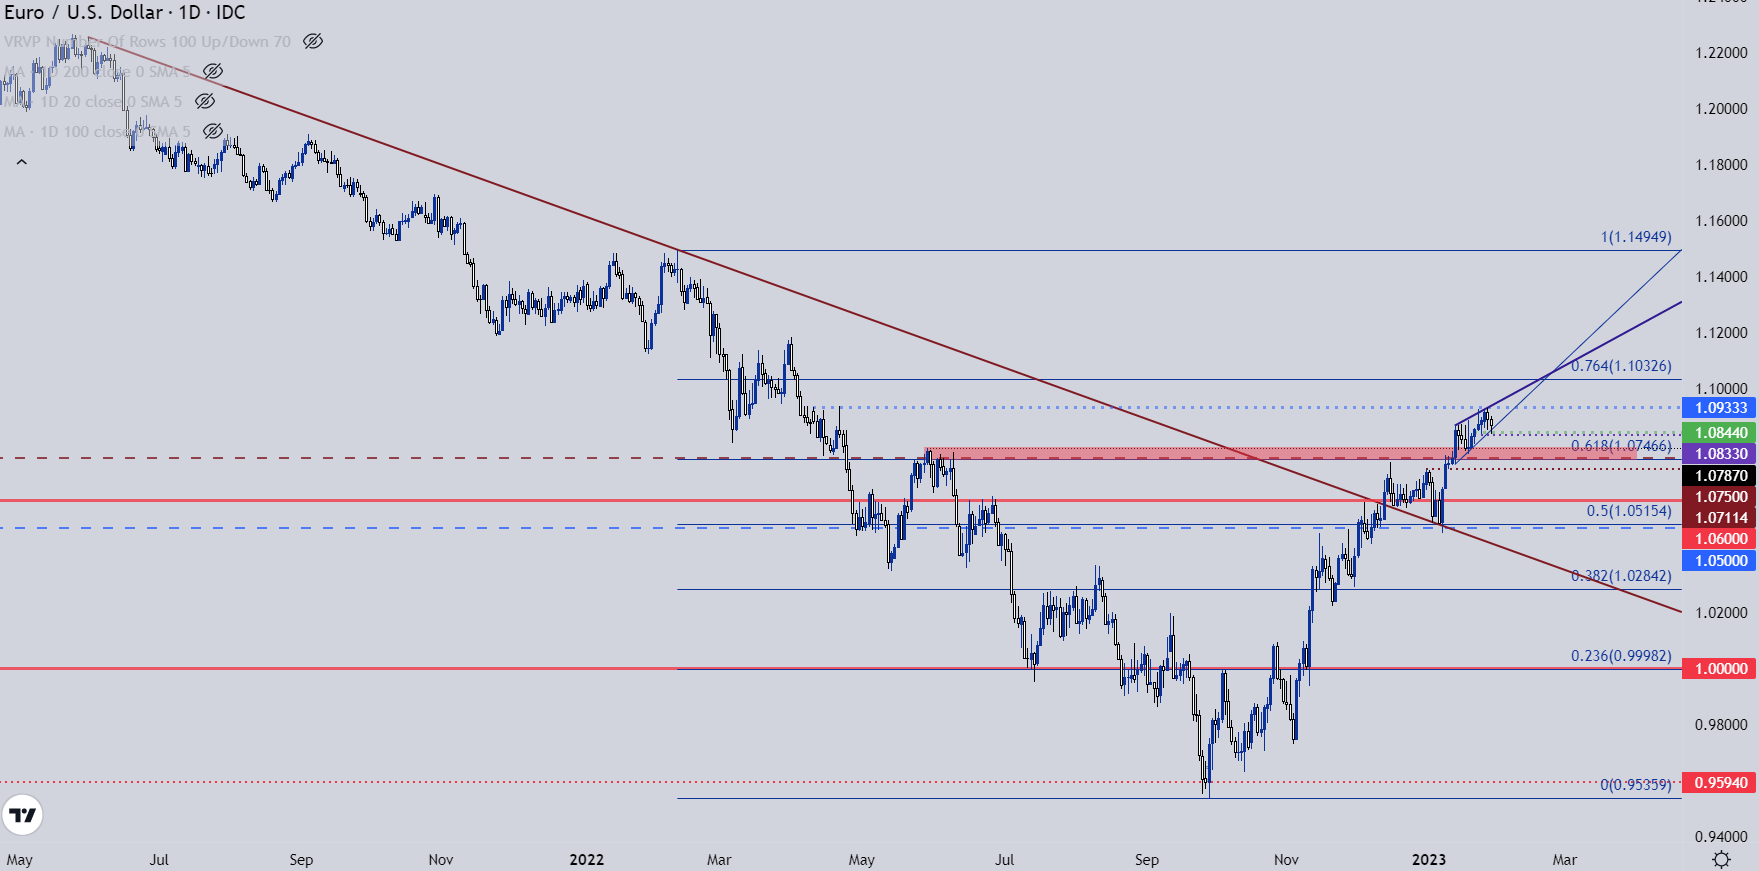
Chart prepared by James Stanley; EURUSD on Tradingview
GBP/USD
GBP/USD has set up with a possible double top formation. The prior high of 1.2447 held the high again last week and the low point between those two highs is at 1.1843 which makes for a little more than 600 pips of distance between the two. Just above that swing high is another spot of resistance as taken from the 1.2500 psychological level.
The double top formation set on Monday and after some initial run on Tuesday, sellers remained largely sidelined as the pair ranged through the rest of last week.
The first key support level is the Fibonacci level at 1.2303 after which 1.2250 comes into play.
GBP/USD Weekly Price Chart
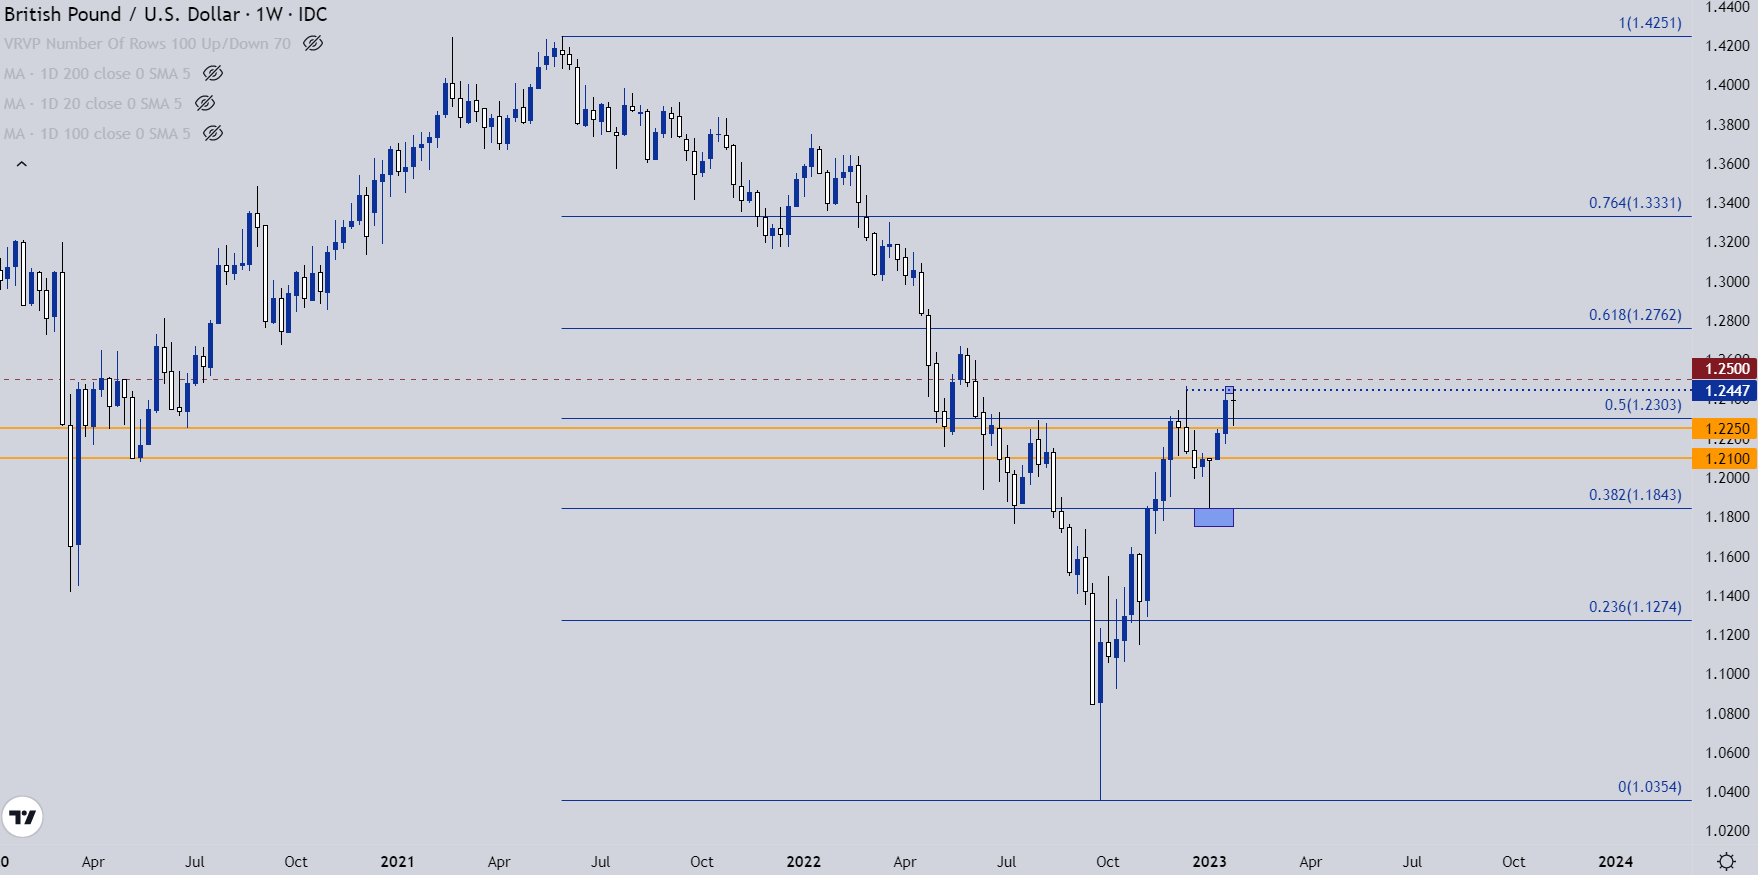
Chart prepared by James Stanley; GBPUSD on Tradingview
USD/CAD
One pair that did not range last week was USD/CAD. The pair broke below a Fibonacci support level to mark a sixth consecutive weekly decline. As I’ve been highlighting in these pieces of late, USD/CAD has been an attractive area for USD bears as CAD-strength has started to show to a greater degree. There’s one more major support level sitting below price and that’s at 1.3226 – which was the high in July of last year before coming in to hold the lows in November. Below that, the 1.3024 level is notable.
USD/CAD Weekly Price Chart
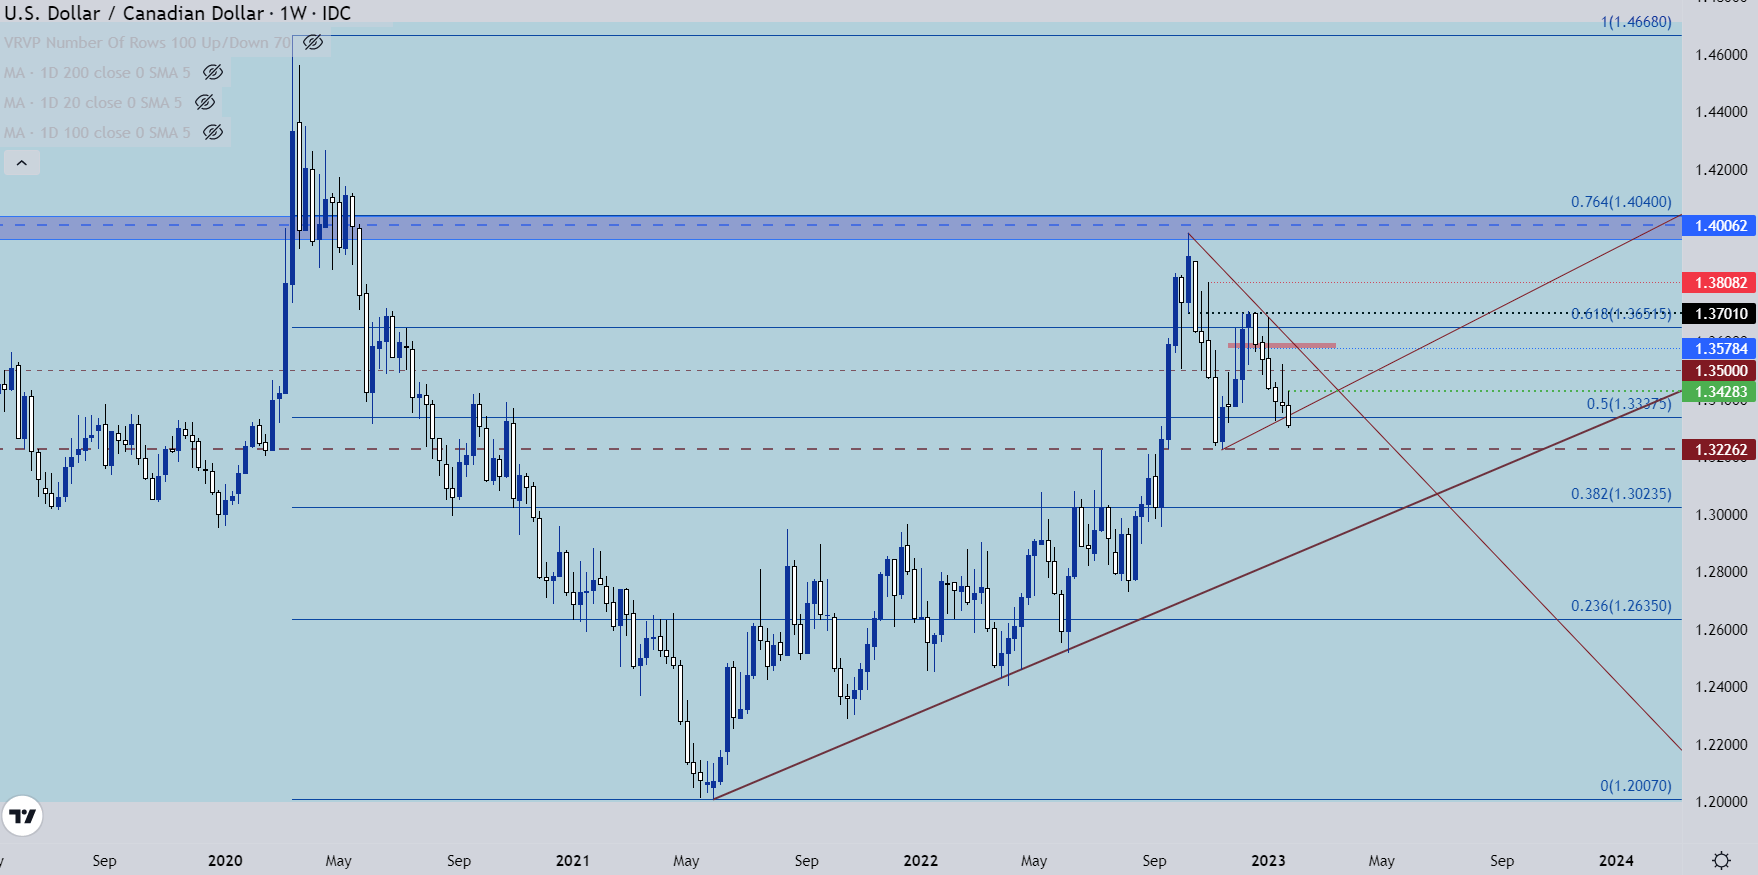
Chart prepared by James Stanley; USDCAD on Tradingview
USD/JPY
USD/JPY traded cautiously higher last week and there were multiple iterations of trendline resistance. And while the carry does remain tilted to the long side of the pair, the bigger question is future policy and while the BoJ just indicated that no changes are on the horizon, inflation remains high in Japan and there’s a possible change atop the BoJ in a couple of months.
So the big question is for how long that Yen-weakness might continue? At this point the bounce appears corrective but that correction may have more scope, even perhaps beyond the bearish trendline. There’s a price action swing at 131.25 that’s of note and that was tested around the BoJ meeting. Above that is the 38.2% Fibonacci retracement from the same study that produced the 50% marker that caught the low two weeks ago. And above that is another key level at 134.45, which was a spot of support-turned-resistance that capped the highs on two separate occasions.
USD/JPY Daily Price Chart
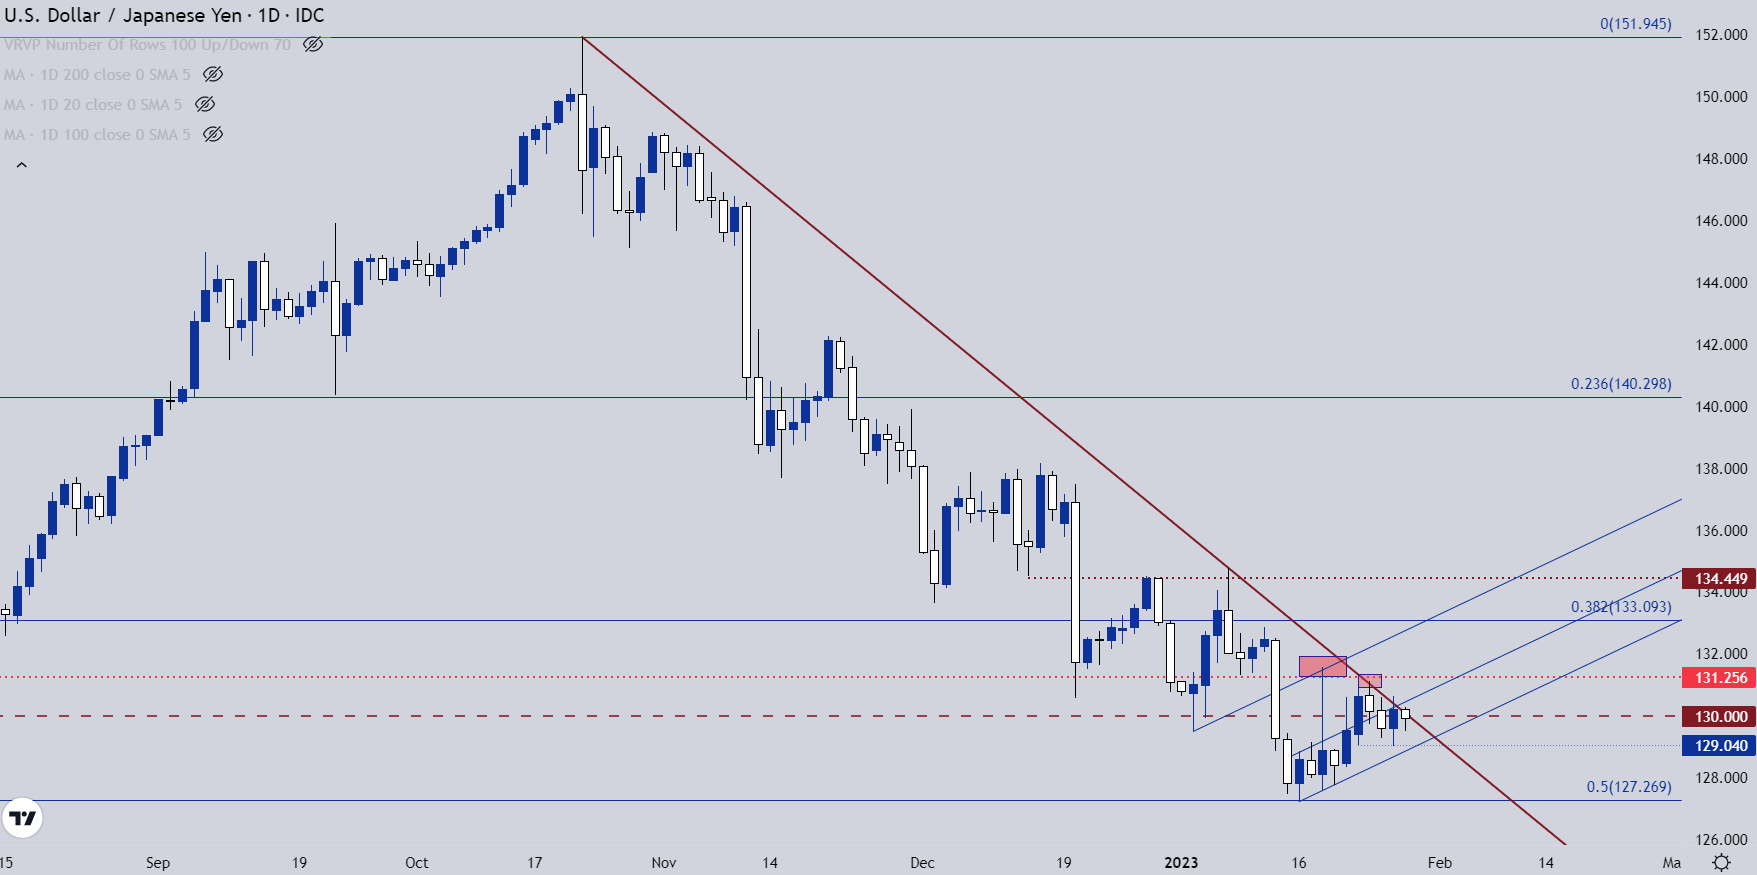
Chart prepared by James Stanley; USDJPY on Tradingview
— Written by James Stanley
Contact and follow James on Twitter: @JStanleyFX
Comments are closed.