

Natural Gas, Head & Shoulders, Hammer – Technical Outlook:
- Natural gas prices aiming for a 6th week of losses
- Hammer candlestick pattern is in focus on the daily
- Closing under May 2021 low resumes the downtrend
Trade Smarter – Sign up for the DailyFX Newsletter
Receive timely and compelling market commentary from the DailyFX team
Subscribe to Newsletter
Weekly Chart – Mild Weather Continues Pointing Natural Gas Lower
Natural gas prices continue to plummet, with the commodity closing under $3 dollars for the first time since May 24th, 2021. The United States and Europe stocking up inventories ahead of winter and mild weather have contributed to the +70% plunge since August. According to Bloomberg, recent weather estimates in the United States have resulted in traders betting on mild temperatures in February.
On the weekly chart below, natural gas continues to move lower in a path projected by a Bearish Head & Shoulders chart pattern. January is shaping up to be a 36% drop. That would be the worst monthly performance since December 2018 as the commodity aims for a 6th consecutive week of losses. Let us take a look at the daily chart to paint a better picture of the near-term price trajectory.
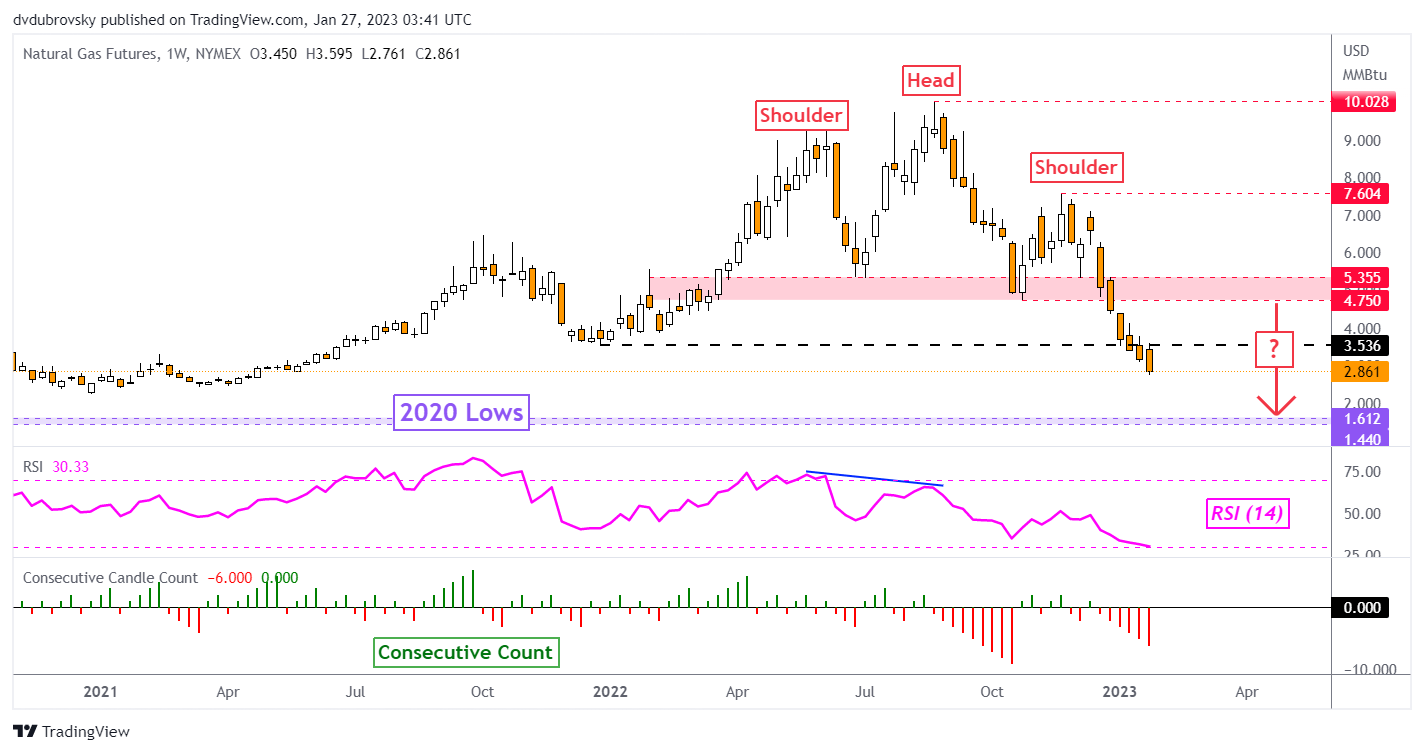
Chart Created Using TradingView
Daily Chart – A Hammer Emerges
On Thursday, natural gas closed just above the May 2021 low. In fact, prices were unable to hold a close under 2.832, reinforcing it as immediate support. The commodity also left behind a Hammer candlestick pattern. A Hammer is often seen as a sign of indecision within downtrends. While its emergence does not necessarily mean that a reversal is coming, it will be important to watch what happens after.
Upside follow-through after the Hammer could open the door to a push higher. That would place the focus on the 20-day Simple Moving Average (SMA). The latter may hold as key resistance, maintaining the dominant downside focus. Even if prices manage to pull further ahead, the broader decline is being maintained by a falling line from August.
A confirmatory downside close under the May 2021 low at 2.832 exposes the 100% Fibonacci extension level at 2.326. Moving toward the latter opens the door to shooting for 2020 lows, which make for a range between 1.44 – 1.612. Reaching this range could be the implied trajectory of the Head & Shoulders seen on the weekly chart.
Recommended by Daniel Dubrovsky
The Fundamentals of Breakout Trading
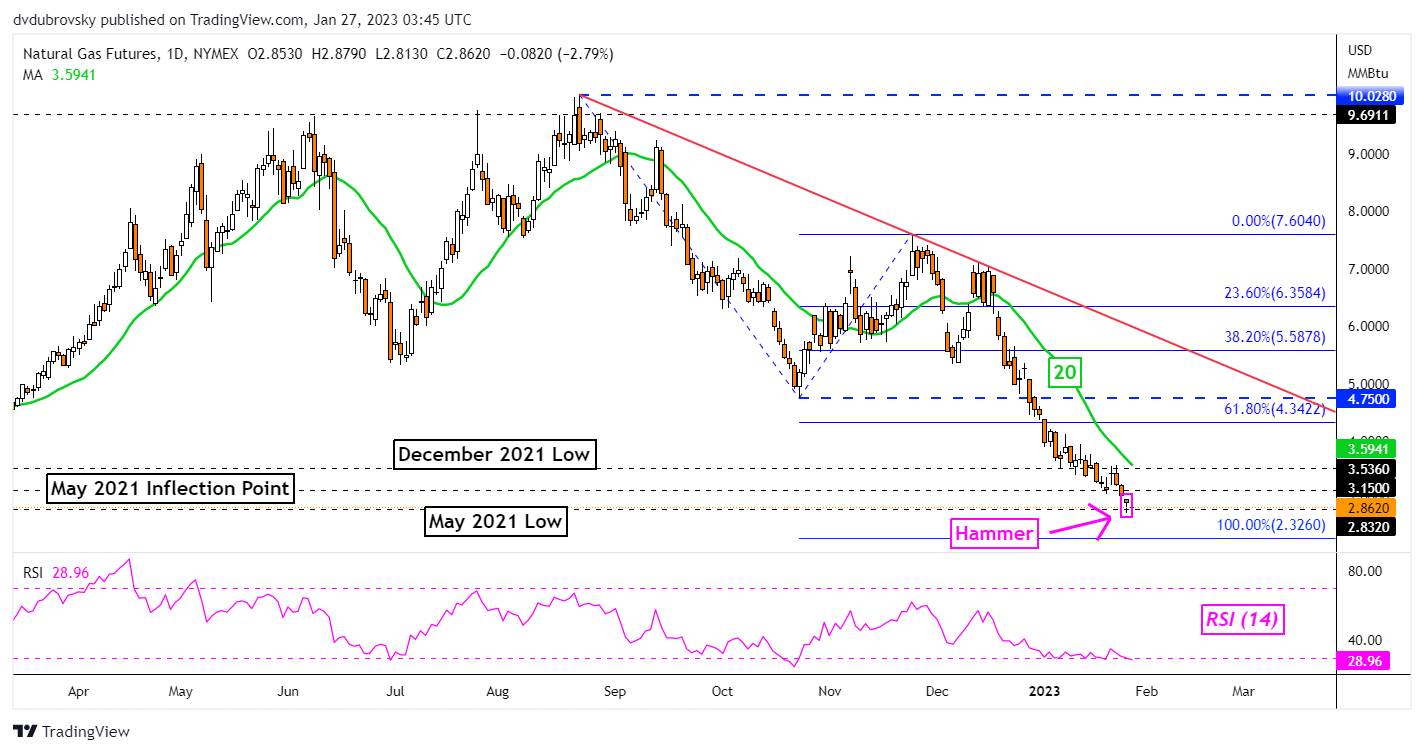
Chart Created Using TradingView
— Written by Daniel Dubrovsky, Senior Strategist for DailyFX.com
To contact Daniel, follow him on Twitter:@ddubrovskyFX
Comments are closed.