

Japanese Yen, USD/JPY, US Dollar, PMI, Nikkei 225, ECB, EUR/USD – Talking Points
- The Japanese Yen inched higher after a tick-up in PMI numbers
- A buoyant mood from US tech stocks spilled into other equity markets
- As the Lunar New Year festivities continue, will thin trade impact USD/JPY?
Recommended by Daniel McCarthy
Get Your Free JPY Forecast
The Japanese Yen gained slightly against the US Dollar today after the Jibun Bank composite PMI came in at 50.8 for January against 49.7 previously.
The manufacturing component was the same as last month’s 48.9 but the services piece was 52.4, above the prior read of 51.1. These are diffusion indices and a measure above 50 is seen as positive for the economy.
The Nikkei 225 index has had a decent rally, trading comfortably above 27,000 today and Australia’s ASX 200 saw modest gains. Most of the rest of the APAC region remains closed for Lunar New Year.
The moves followed a positive session on Wall Street that was led higher by the Nasdaq, which added 2.01%
Overnight, the ECB’s Christine Lagarde reiterated the bank’s mission to get inflation back down to its goal of 2%. Euro-zone year-on-year headline CPI to the end of December is 9.2%. EUR/USD is little changed so far today.
The US State Dept Special Envoy Robert Malley called out China’s continuing support of Iran oil purchases. Crude oil has also had a quiet Asian session in thin trading conditions.
The WTI futures contract is above US$ 81.50 bbl while the Brent contract is a touch over US$ 88.00 bbl. Gold is slightly firmer above US$ 1,930.
Looking ahead, today will PMI data across Europe, the UK and North America.
The full economic calendar can be viewed here.
Recommended by Daniel McCarthy
How to Trade USD/JPY
USD/JPY TECHNICAL ANALYSIS
USD/JPY is pausing at resistance today after starting the week adding to gains seen on Friday.
The price remains in a descending trend channel, but it is currently bumping up against the upper bound of that channel.
The 21-day simple moving average (SMA) is just above that trendline and may also offer resistance ahead of last week’s high of 131.58.
Further up, resistance might be offered in the 134.50 – 134.75 zone where there are two prior peaks. The 55-day SMA is currently just above this area.
On the downside, support might lie at the April and May lows from last year at 125.11, 126.33 and 126.36. Last Monday’s low of 127.22 could provide close-by support.
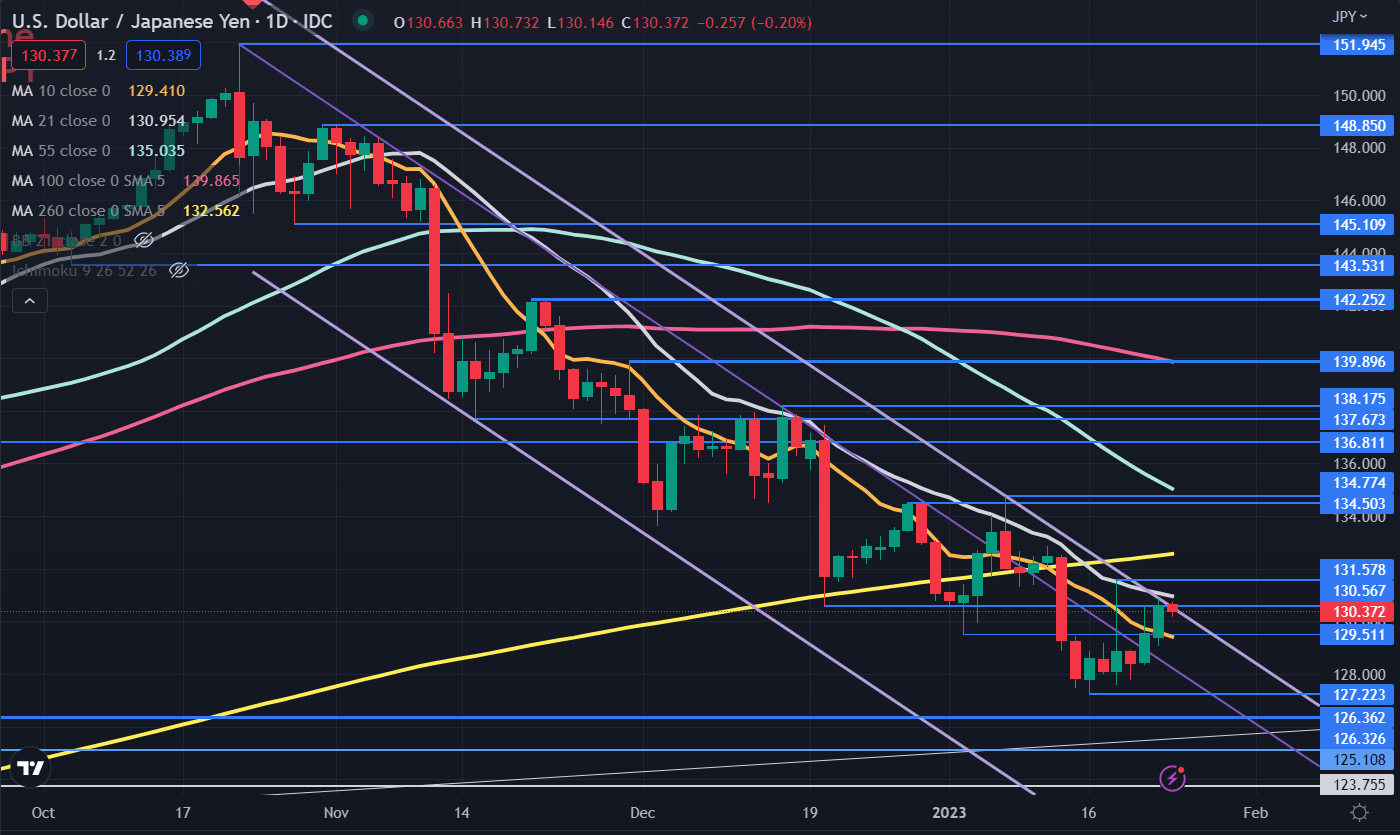
Chart created in TradingView
— Written by Daniel McCarthy, Strategist for DailyFX.com
Please contact Daniel via @DanMcCathyFX on Twitter
Comments are closed.