
Heads up, commodity traders!
I’m seeing a reversal pattern on the 4-hour chart of crude oil, and it looks ready to play out.
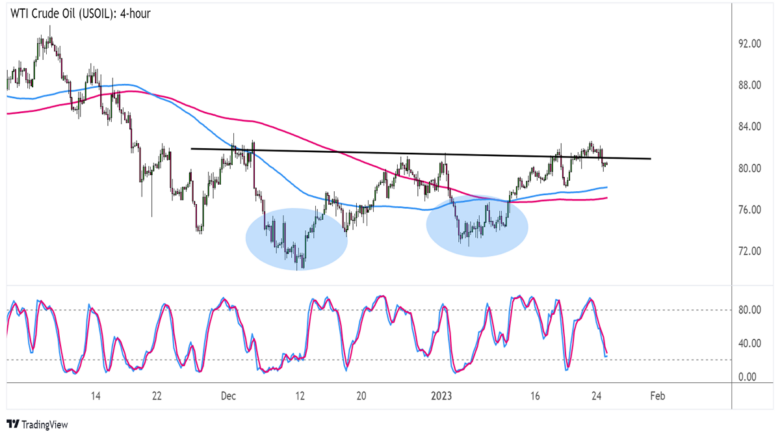
Here are the levels I’m watching:

WTI Crude Oil (USOIL) 4-hour Chart by TradingView
Anyone hoping to catch the crude oil rally?
More gains might be in the cards, as the commodity price formed a double bottom and is currently testing the neckline.
A break higher could set off a climb that’s the same height as the chart formation, which spans around $72-82 per barrel.
Technical indicators seem to be lining up for a bullish breakout, too. The 100 SMA recently crossed above the 200 SMA to reflect upside pressure, and the gap is widening to signal strengthening momentum.
While Stochastic is on the move down for now, the oscillator is already inching close to the oversold region to indicate exhaustion among sellers. Turning higher could convince more crude oil bulls to charge past the resistance level.
Just be careful since the API just reported that private oil inventories saw another build last week. Stockpiles rose by 3.378 million barrels, so the upcoming EIA report might print similar results.
In that case, market players stay wary of weaker demand conditions, despite easing fears of a sharp recession. Better stay on your toes for a dip back to the $72 per barrel region if risk-off flows persist!
This content is strictly for informational purposes only and does not constitute as investment advice. Trading any financial market involves risk. Please read our Risk Disclosure to make sure you understand the risks involved.
Comments are closed.