

Number of traders net-short has increased by 5.29% from last week.
| SYMBOL | TRADING BIAS | NET-LONG% | NET-SHORT% | CHANGE IN LONGS | CHANGE IN SHORTS | CHANGE IN OI |
|---|---|---|---|---|---|---|
| US 500 | BEARISH | 50.31% | 49.69% |
14.42% Daily 8.31% Weekly |
-7.90% Daily 5.29% Weekly |
2.12% Daily 6.79% Weekly |
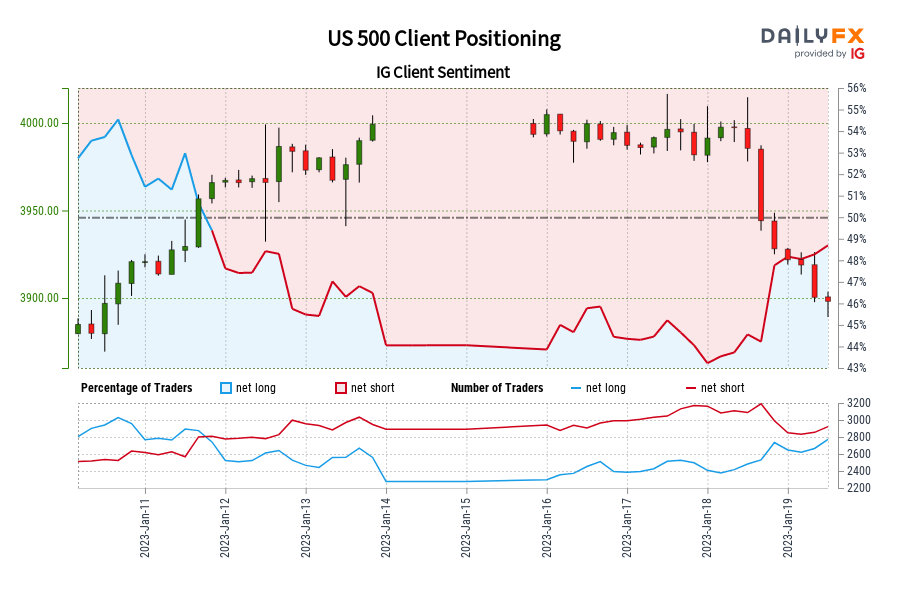
US 500: Retail trader data shows 50.31% of traders are net-long with the ratio of traders long to short at 1.01 to 1. In fact, traders have remained net-long since Jan 11 when US 500 traded near 3,965.94, price has moved 1.71% lower since then. The number of traders net-long is 14.42% higher than yesterday and 8.31% higher from last week, while the number of traders net-short is 7.90% lower than yesterday and 5.29% higher from last week.
We typically take a contrarian view to crowd sentiment, and the fact traders are net-long suggests US 500 prices may continue to fall.
Our data shows traders are now net-long US 500 for the first time since Jan 11, 2023 18:00 GMT when US 500 traded near 3,965.94. Traders are further net-long than yesterday and last week, and the combination of current sentiment and recent changes gives us a stronger US 500-bearish contrarian trading bias.
Comments are closed.